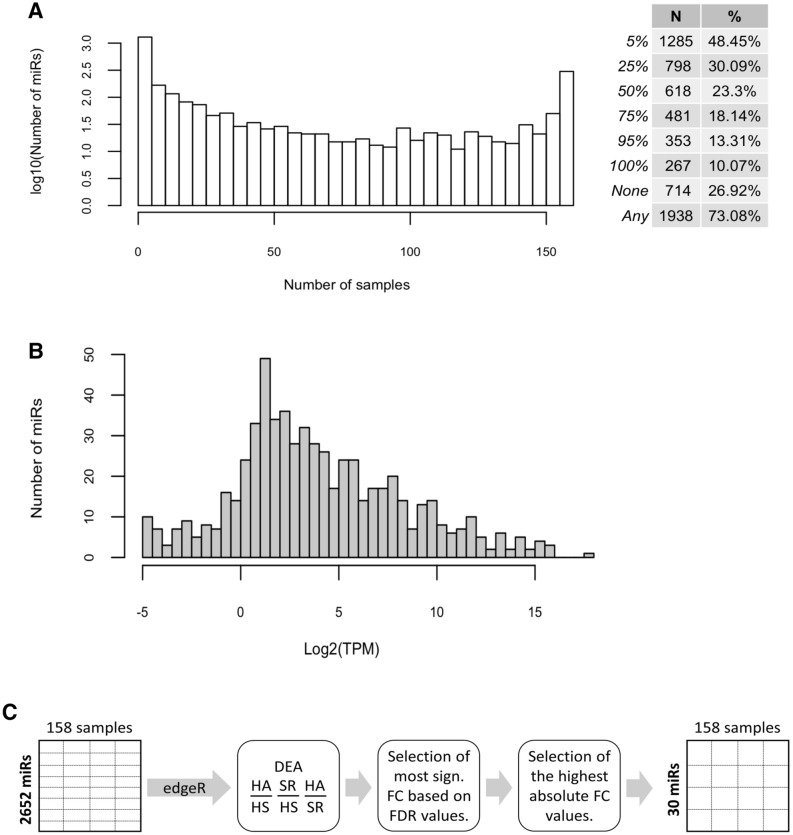
Figure 1.
Summary of analysis of EXAMIN AGE data. (A). Distribution of the number of individual miRNAs detected in specific numbers of samples and number and percentage of mature miRs identified in the indicated proportions of samples. (B). Numbers of miRNAs with specific values of median expression across samples (miRNAs with zero median expression are not shown). (C). Outline of the comparison of miRNA expression between groups of patients. DEA differential expression analysis, HA healthy active, HS healthy sedentary, SR sedentary at increased CV risk, FC fold change, FDR false discovery rate.

