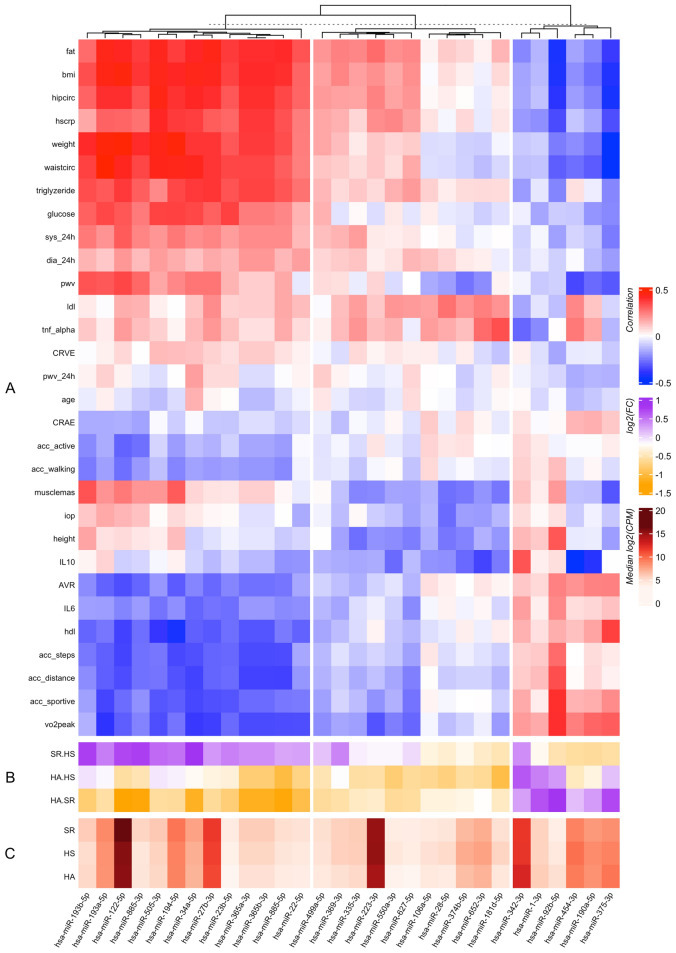
Figure 3.
Relationship between miRNA expression levels and values of various physiological parameters. (A) Correlation coefficients have been calculated between the miRNA expression levels and the values of the indicated physiological parameters. (B) Fold-changes of the corresponding miRNAs among the indicated pairs of samples. (C) Median expression level of these miRNAs across samples (in counts per million, CPM). Fat fat mass, BMI body mass index, hipcirc hip circumference, hscrp high sensitive C-reactive protein, waistcirc waist circumference, sys_24h systolic blood pressure based on 24 h monitoring, dia_24h diastolic blood pressure based on 24 h monitoring, pwv pulse wave velocity, ldl low-density lipoprotein, tnf_alpha tumor necrosis factor alpha, CRVE central retinal venular equivalent, pwv_24h pulse wave velocity based on 24 h monitoring, CRAE central retinal arteriolar equivalent, ACC accelerometer, active activity counts, iop intraocular pressure, IL interleukin, AVR arteriolar-to-venular diameter ratio, hdl high-density lipoprotein, VO2peak peak oxygen uptake, HA healthy active individuals, HS healthy sedentary individuals, SR sedentary individuals with at least 2 cardiovascular risk factors.

