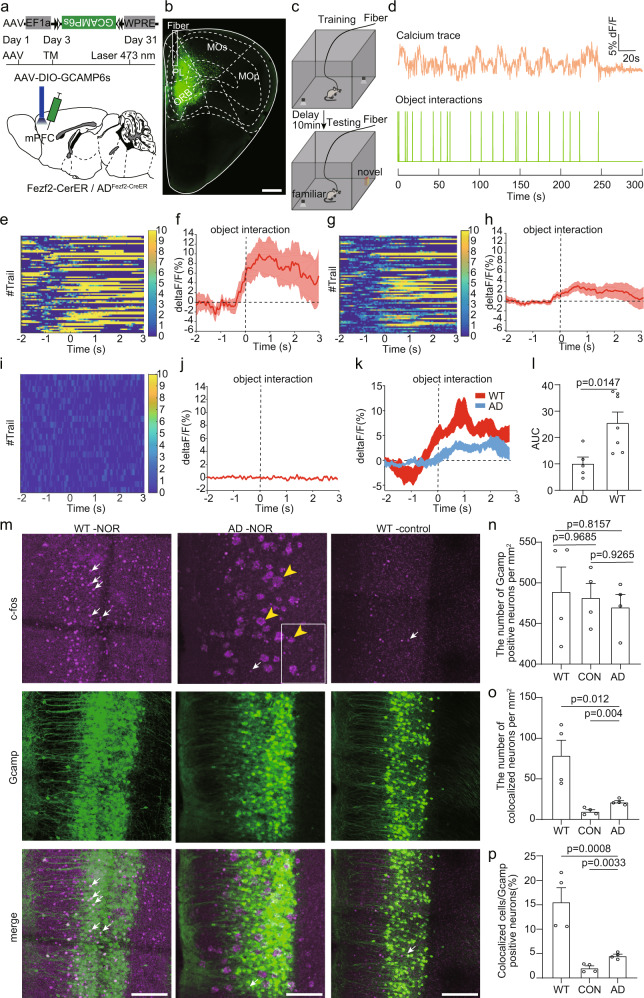
Fig. 1. Altered response of extratelencephalic projection neurons to objects in the mPFC of 5×FAD mice.
a The experimental strategy of recording the activity of extratelencephalic projection neurons in the mPFC with fiber photometry. b An example image showed the virus injection site and the position of the optical fiber. c The experimental procedure of novel object recognition test. d An example showed the trace of the calcium signal and the time point of the object interaction during object recognition test. e Heatmap of Ca2+ transients of extratelencephalic projection neurons in PL of Fezf2-CreER mice during object interactions. f Average plots across different trials of individual animals show that object interactions activated extratelencephalic projection neurons in mPFC. g Heatmap of Ca2+ transients of extra telencephalic projection neurons in PL of AD Fezf2-CreER mice during object interactions. h Average plots across different trials of individual animals show that object interactions activated extratelencephalic projection neurons in mPFC of 5×FAD mice. i Heatmap of Ca2+ transients of extratelencephalic projection neurons in PL of Fezf2-CreER mice during object interactions. The GFP was expressed in the PL instead of GCaMP6s. j Average plots across different trials of individual animals show that object interactions did not evoke clear response in GFP positive neurons. k The average plots of the calcium response from different animals. l. The quantification of area under curve (AUC) in k. two-tailed unpaired t test was used, Fezf2-CreER mice, n = 7 animals; ADFezf2-CreER, n = 5 animals. m Immunostaining against c-fos to validate the extratelencephalic projection neurons were activated in the object recognition test. White arrow indicates c-fos, yellow arrow indicates Aβ plaques. n Quantification of the number of extratelencephalic projection neurons that expressed GCaMP in the mPFC. n = 4 animals. One-way repeated-measures (RM) ANOVA with Tukey’s post hoc test. o Quantification of number of c-fos positive extratelencephalic projection neurons in the mPFC. one-way repeated-measures (RM) ANOVA with Tukey’s post hoc test, n = 4 animals. p Quantification of the percentage of c-fos positive extratelencephalic projection neurons in the mPFC. one-way repeated-measures (RM) ANOVA with Tukey’s post hoc test, n = 4 animals. Scale bar in b is 500 μm. Scale bar in m is 100 μm. All data are listed as the Mean ± SEM. The color bars in the figure indicated df/f (%). NOR, novel object recognition test. TM, tamoxifen.

