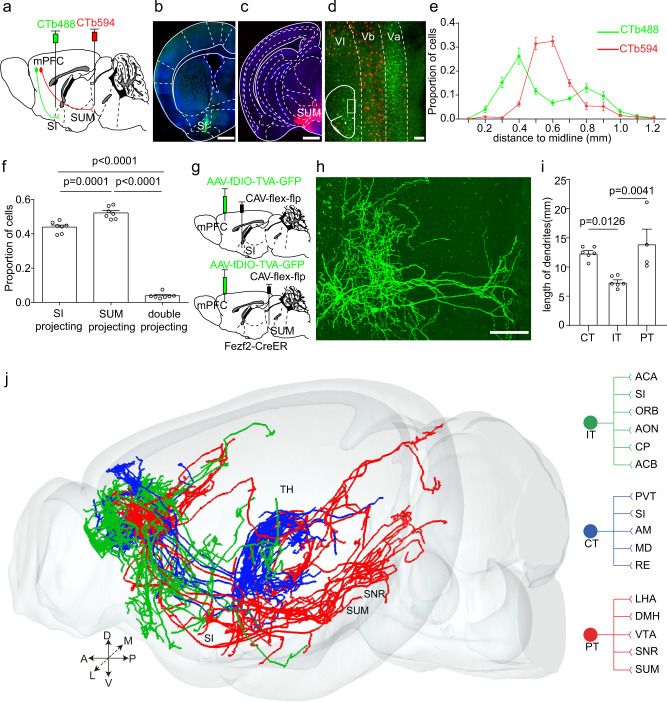
Fig. 4. SI and SUM projection neurons in the mPFC are anatomically different.
a The strategy to label mPFC-SI projection neurons and mPFC-SUM projection neurons with CTb. b, c The injection site of CTb in SI and SUM. d An example image showed the distribution of CTb labeled neurons in the mPFC. e Quantification of the distribution of different CTb labeled neurons in mPFC along the depth of the cortical layers. n = 7 animals. f Quantification of the percentage of different CTb labeled neurons in the mPFC, n = 7 animals. one-way repeated-measures (RM) ANOVA with Tukey’s post hoc test. SI projecting vs double projecting, p = 3.1×10⁻¹⁴; SUM projecting vs double projecting, p = 2.7×10⁻¹⁴. g The experimental strategy of sparse labeling of the morphology of PFC-SI projection neurons and PFC-SUM projection neurons with AAV. h An example image showed the sparse labeled neurons in the mPFC. i Quantification of the dendritic length of different types of neurons. one-way repeated-measures (RM) ANOVA with Tukey’s post hoc test, CT neurons, n = 6; IT neurons, n = 6; PT neurons, n = 4. j The whole-brain axon projection of different types of neurons in the mPFC and their main target brain areas. Scale bars in b, c are 500 μm. Scale bar in d is 100 μm. Scale bar in h is 100 μm. A anterior, D dorsal. L, lateral, M medial, P posterior, V ventral, SI substantia innominata, SUM supramammillary nucleus, IT intratelencephalic, PT pyramidal tract, CT corticothalamic, ACA anterior cingulate area, ORB orbital cortex, AON anterior olfactory nucleus, CP, caudate putamen, ACB nucleus accumbens, PVT paraventricular thalamic nucleus, AM anteromedial thalamic nucleus, MD mediodorsal thalamic nucleus, RE reuniens thalamic nucleus, LHA lateral hypothalamic area, DMH dorsomedial hypothalamic nucleus, VTA ventral tegmental area, SNR substantia nigra, reticular part. All data are listed as the Mean ± SEM.

