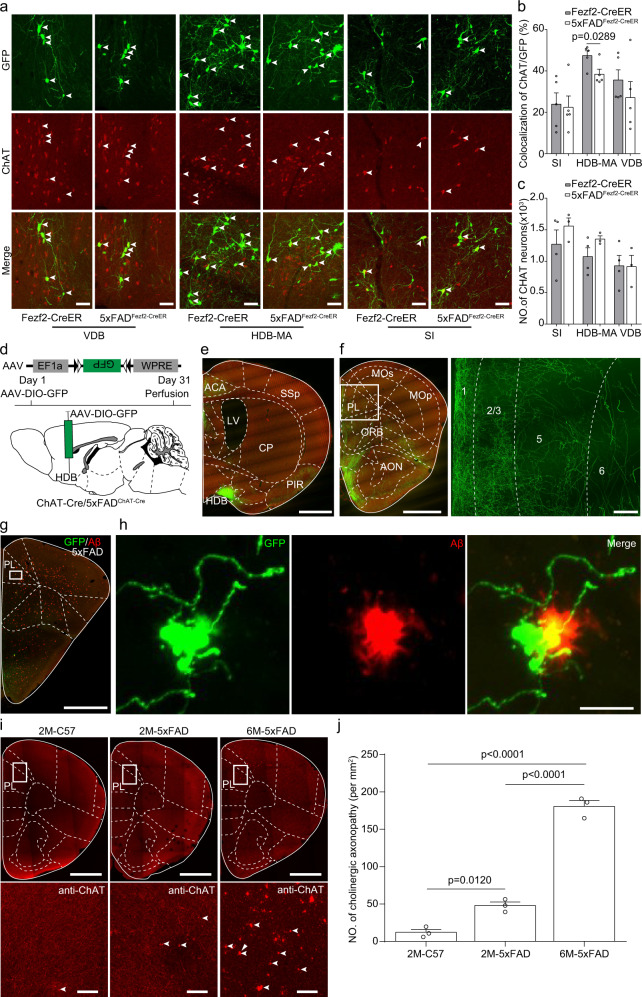
Fig. 5. Decreased cholinergic inputs from horizontal diagonal band to extratelencephalic projection neurons in the mPFC of 5×FAD mice.
a Immunostaining against ChAT (red) to identify the rabies labeled cholinergic input neurons (green) from vertical diagonal band, horizontal diagonal band and SI to extratelencephalic projection neurons in the mPFC. b Comparison of rabies virus labeled ChAT neurons between ADFezf2-CreER and Fezf2-CreER mice in vertical diagonal band, horizontal diagonal band, and SI brain area (n = 5 animals for AD, n = 5 animals for WT). All error bars represent Mean ± SEM and the significant differences were indicated by p value (two-tailed unpaired t test). c Comparison of the number of cholinergic neurons between ADFezf2-CreER and Fezf2-CreER mice in the vertical diagonal band, horizontal diagonal band, and SI brain area (two-tailed unpaired t test, n = 3 animals for AD, n = 4 animals for WT). d Labeling the output of cholinergic neurons in the horizontal diagonal band of ADChAT-Cre mice or ChAT-Cre mice. e The virus injection site at the horizontal diagonal band. f The cholinergic axon terminals in the mPFC. g The cholinergic axon terminals and the Aβ plaques in the mPFC of ADChAT-Cre mice. h Enlarged image boxed in g showed the degenerated cholinergic axons in the mPFC. i Representative images showed the cholinergic axonopathy in the mPFC of 5×FAD mice at different ages. j Quantification of the cholinergic axonopathy in the mPFC of 5×FAD mice at different ages. n = 3 animals for each group. one-way repeated-measures (RM) ANOVA with Tukey’s post hoc test. 2M-C57 vs. 6M-5×FAD, p = 0.000002209; 2M-5×FAD vs 6M-5×FAD, p = 0.000009272. Scale bars in e, f (left) and g are 1 mm. Scale bar in f (right) is 100 μm. Scale bars in a and h are 50 μm. Scale bars in g, I (upper) are 1 mm. Scale bars in I (lower) are 50 μm. SI substantia innominata, HDB horizontal diagonal band, MA magnocellular nucleus, ACA anterior cingulate area, CP caudate putamen, PIR piriform cortex, LV lateral ventricle, SSp primary somatosensory area, PL prelimbic area, ORB orbital cortex, AON anterior olfactory nucleus, Mop primary motor area, MOs secondary motor area. All data are listed as the Mean ± SEM.

