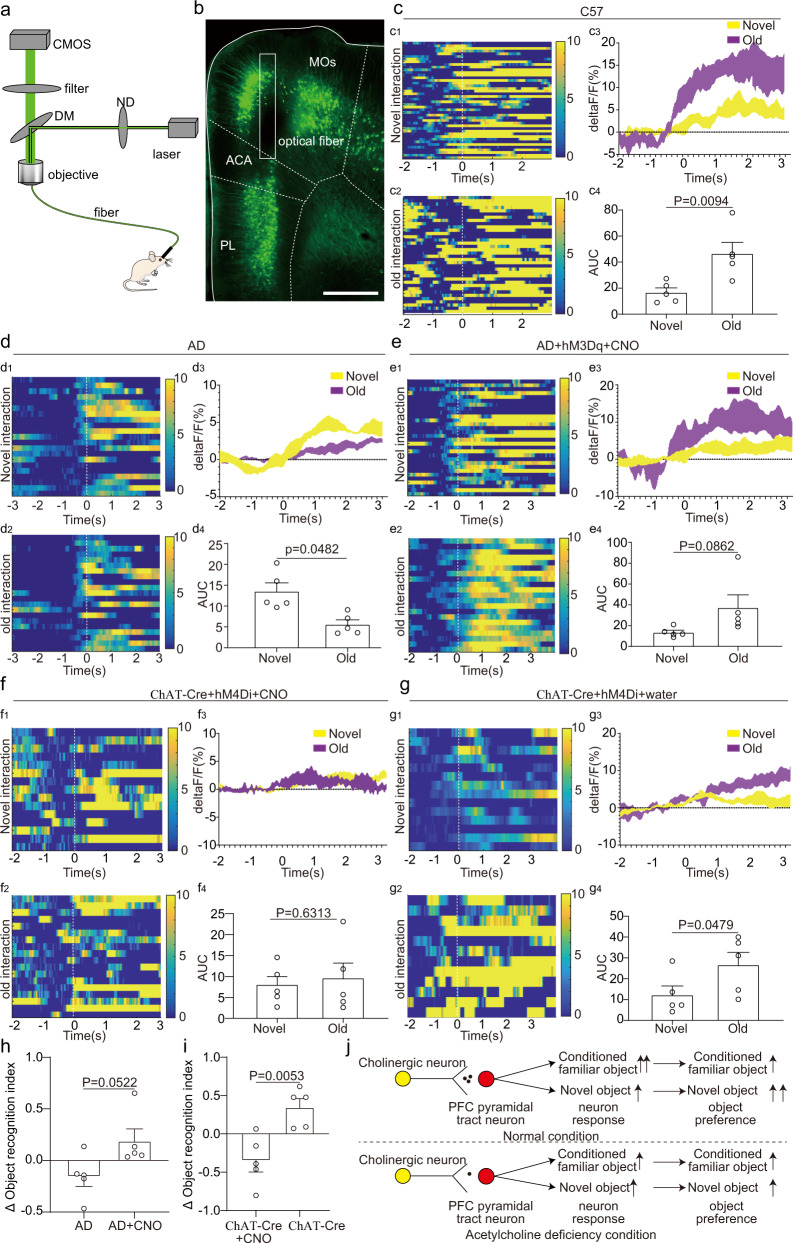
Fig. 8. Acetylcholine deficiency to extratelencephalic projection neurons in the mPFC altered the response patterns of extratelencephalic projection neurons in the mPFC to novel object and familiar object.
a The experimental strategy of fiber photometry. b The position of optical fibers in the mPFC for fiber photometry. c The response of extratelencephalic projection neurons in the mPFC of C57 mice to familiar object and novel object. c1-c3, Heatmap of calcium response of individual animal and average response plots of extratelencephalic projection neurons in the mPFC of different C57 mice. c4, Quantification of AUC in c3. n = 5 animals. d The response of extratelencephalic projection neurons in the mPFC of 5×FAD mice to familiar object and novel object. d1-d3, Heatmap of calcium response of individual animal and average response plots of extratelencephalic projection neurons in the mPFC of different 5×FAD mice. d4, Quantification of AUC in d3. n = 5 animals. e The response of extratelencephalic projection neurons in the mPFC of 5×FAD mice to familiar object and novel object during the activation of cholinergic neurons in the horizontal diagonal band with chemogenetics. e1-e3, Heatmap of calcium response of individual animal and average response plots of extratelencephalic projection neurons in the mPFC of different 5×FAD mice with cholinergic activation. e4, Quantification of AUC in e3. n = 5 animals. f The response of extratelencephalic projection neurons in the mPFC of ChAT-Cre mice with cholinergic neuron inhibition via chemogenetics. f1-f3, Heatmap of calcium response of individual animal and average response plots of extratelencephalic projection neurons in the mPFC of different ChAT-Cre mice with cholinergic inhibition. f4, Quantification of AUC in f3. n = 5 animals. g The response of extratelencephalic projection neurons in the mPFC of ChAT-Cre mice (control group). g1-g3, Heatmap of calcium response of individual animal and average response plots of extratelencephalic projection neurons in the mPFC of different ChAT-Cre mice. g4, Quantification of AUC in g3. n = 5 animals. h Delta object recognition index comparison between 5×FADChAT-Cre group and 5×FADChAT-Cre chemogenetics activation group. n = 5 animals. i Delta object recognition index comparison between ChAT-Cre group and ChAT-Cre chemogenetics inhibition group. n = 5 animals. j The scheme of how acetylcholine regulates the response of extratelencephalic projection neurons in the mPFC to novel object and familiar object. c, d, f, g, two-tailed paired t test. e two-tailed Wilcoxon matched-pairs signed-rank test. h two-tailed Mann-Whitney test; i, two-tailed unpaired t test. Scale bar in b is 500 μm. MOs, secondary motor area; ACA, anterior cingulate area; PL, prelimbic area. All data are listed as the Mean ± SEM. The color bars in the figure indicated df/f (%).

