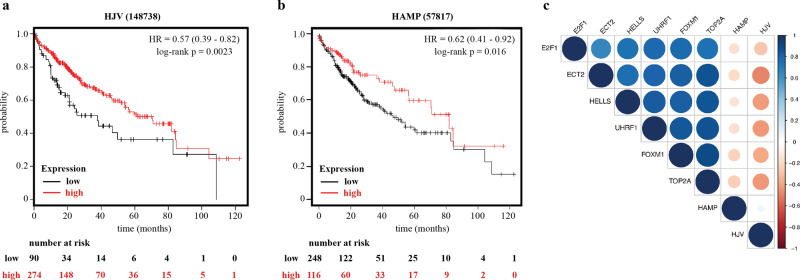
Fig. 10. Expression of HJV and HAMP as a prognostic biomarker in HCC.
Survival analysis in 364 HCC patients plotted against expression of: a HJV; and b HAMP. c Spearman’ s rank correlation coefficients of expression levels among HJV, HAMP and the oncofetal markers E2F1, ECT2, HELLS, UHRF1, FOXM1 and TOP2A. The size and more intense colors indicate stronger correlations (blue for positive and red for negative correlation). The plotting graph was designed using the corrplot package (https://github.com/taiyun/corrplot). All RNAseq data were obtained from the TCGA HCC dataset.

