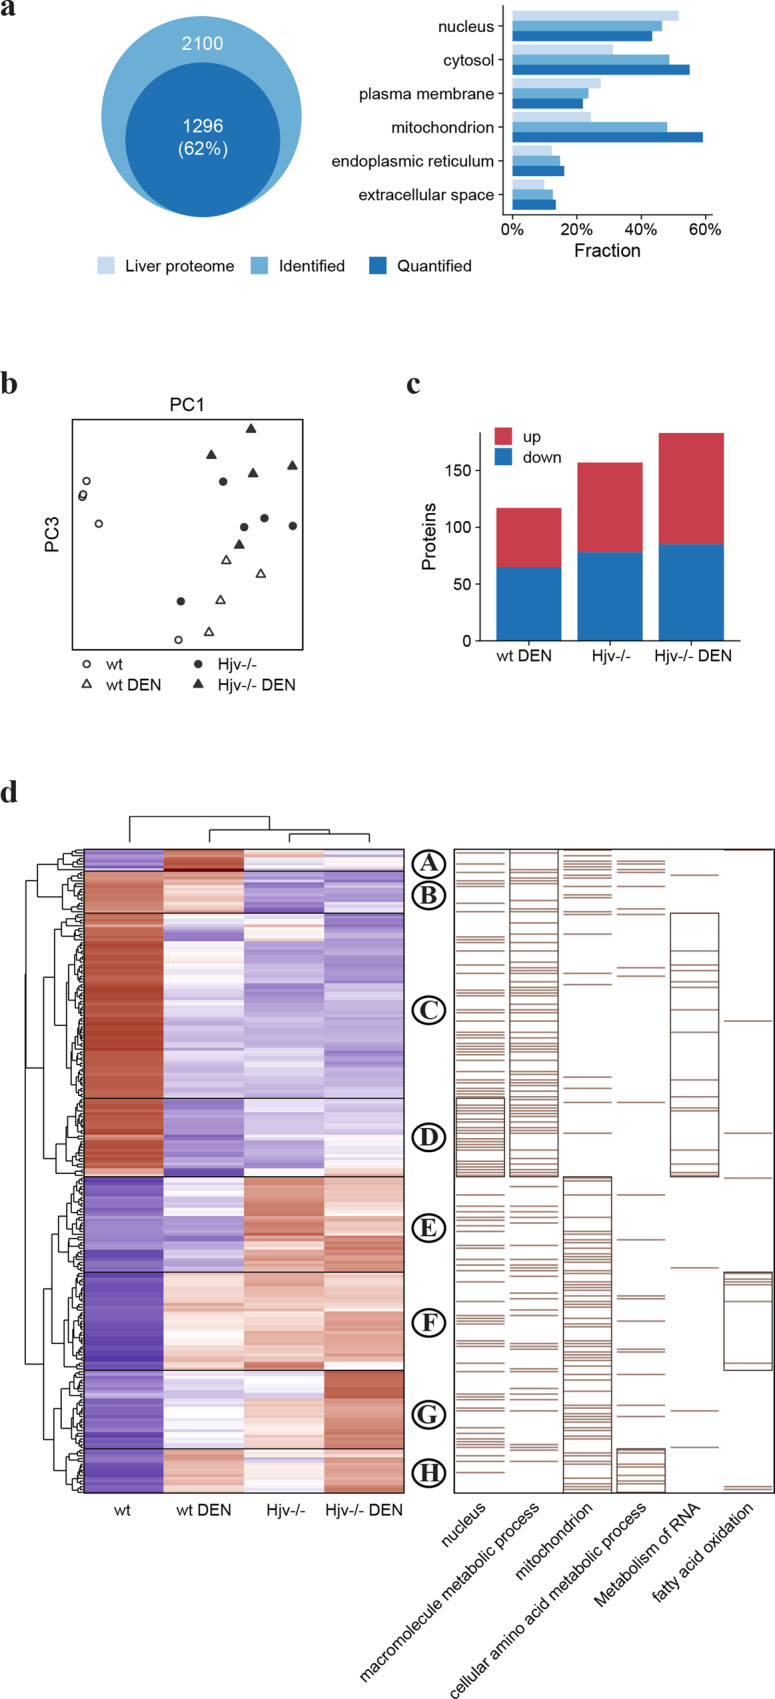
Fig. 2. Alterations in the liver proteome of wild type and Hjv−/− mice following DEN treatment.

a Gene ontology analysis and subcellular distribution of quantified liver proteome compared to maximal detectable mouse liver proteome. b Principal component analysis (PCA) comparing the four mouse groups based on component 1 and 4, accounting for 26.6% and 7.6% of variability, respectively. c Number of differentially expressed proteins compared to wild type control mice. d Heat map of mean z-scored protein LFQ intensities of 230 differentially expressed proteins (ANOVA FDR < 0.05) after unsupervised hierarchical clustering. Enriched Gene Ontology terms among protein clusters are shown on the right. Bars represent position of annotated proteins; subclusters with highest enrichment (Fisher’s exact test p-value) for each term are framed.
