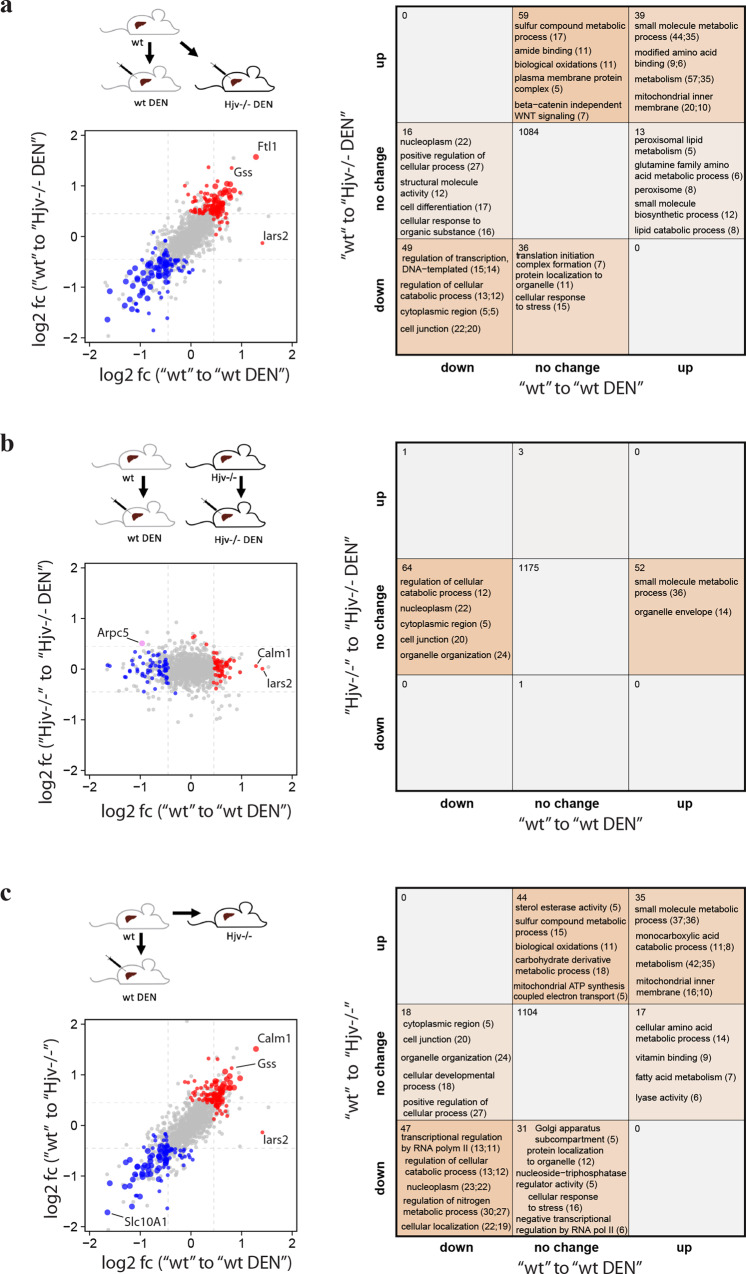
Fig. 3. Comparative analysis of liver proteomes in wild type and Hjv−/− mice following DEN treatment.
a Liver proteomic changes between wild type versus DEN-treated wild type and Hjv−/− mice. b Liver proteomic changes in response to DEN treatment in wild type and Hjv−/− mice. c Liver proteomic changes in response to DEN treatment and Hjv deficiency. (Left) Log2 fold-changes (log2 fc) of differentially expressed proteins (Tukey p < 0.05, abs. log2 fold change >0.45). Red = upregulated, blue = downregulated, large point = significant in both. (Right) Number of significantly changed proteins and enriched annotations (Fisher’s exact test p < 0.05) of respective protein sets.

