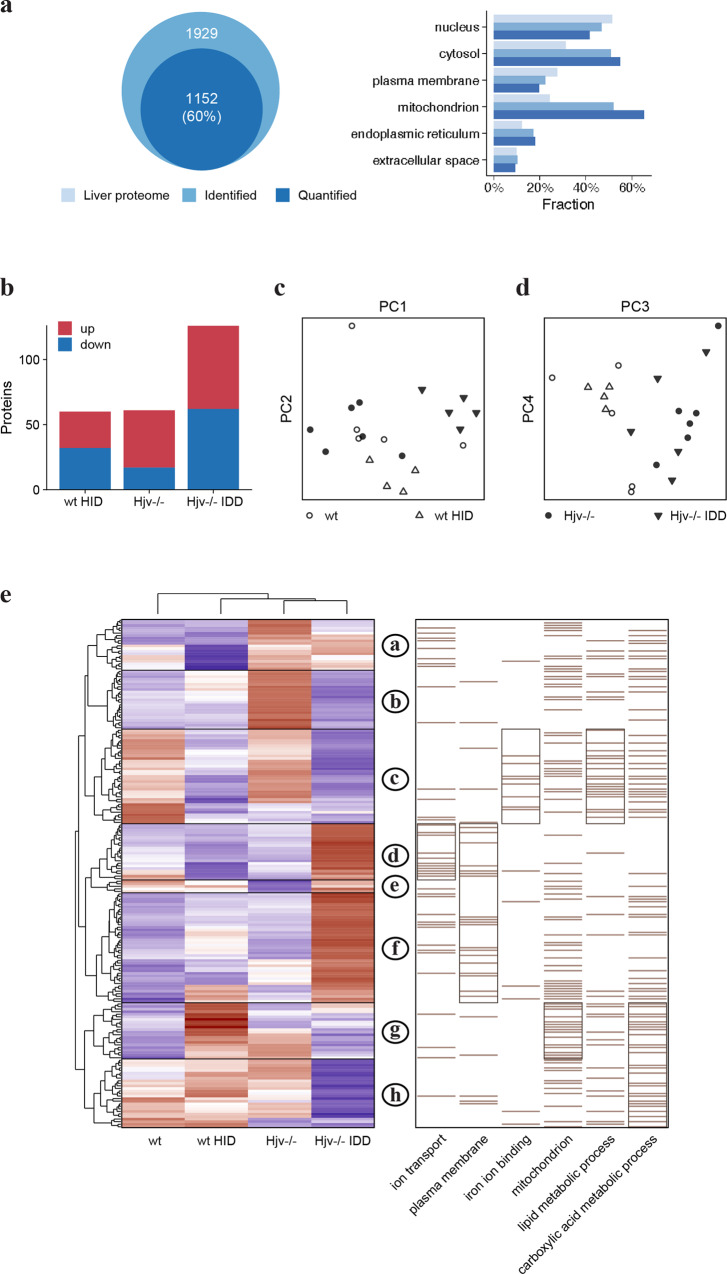
Fig. 6. Liver proteomic profiles of wild type and Hjv−/− mice after dietary iron manipulations.
a Gene ontology analysis and subcellular distribution of quantified liver proteome compared to maximal detectable mouse liver proteome. b Number of differently expressed proteins compared to wild type mice on standard diet. c Principal component analysis (PCA) of the four mouse groups based on component 1 and 2 (top), accounting for 25.5% and 11.3% of variability, and d components 3 and 4 (bottom), accounting for 9% and 6.8% of variability, respectively. e Heat map of mean z-scored protein LFQ intensities of 199 differentially expressed proteins (ANOVA FDR < 0.05) after unsupervised hierarchical clustering. The order of sample groups has been manually adjusted. Enriched Gene Ontology terms among protein clusters are shown on the right. Bars represent protein annotations and enriched clusters of proteins are framed.

