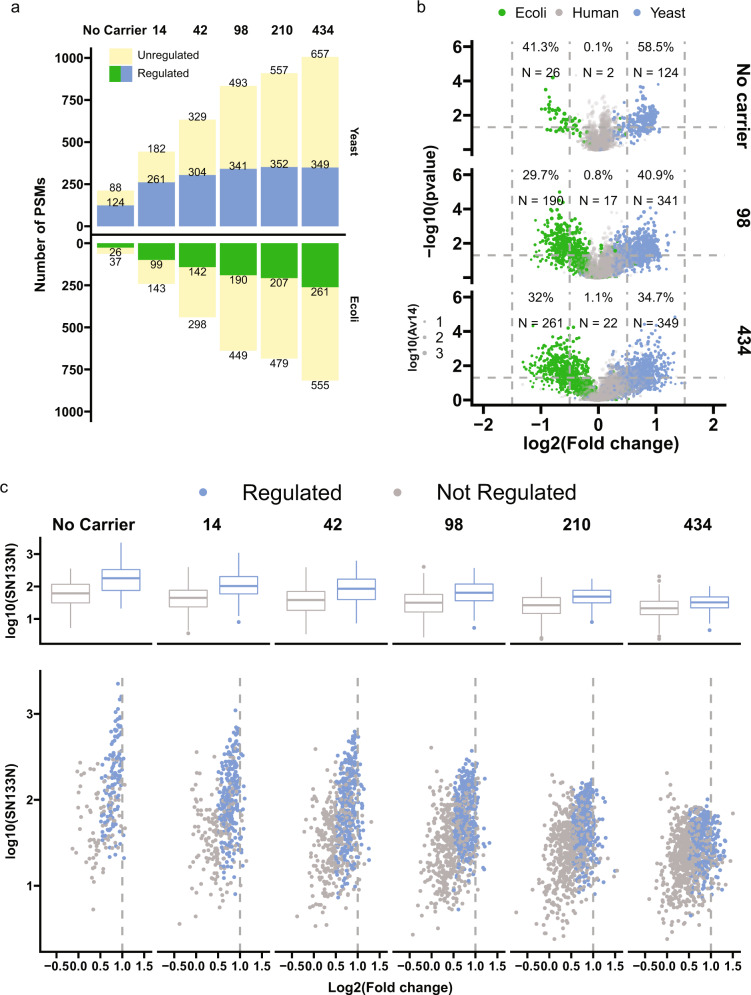
Fig. 2. Impact of the carrier proteome for detecting significantly regulated proteins.
a Numbers of PSMs accurately quantified with selected TMT channels. From the 14 SCCs, we calculated log2 ratios including, 131 C/132 N, 131 C/132 N, 131 C/132 N, and 131 C/132 N for yeast and human PSMs, 128 N/128 C, 129 N/130 C, 129 C/131 C, and 130 N/132 C for E.coli PSMs. PSMs with Parent intensity fraction ≥ 0.98 and Av14 ≥ 1 were kept. Samples with the following settings were selected: carrier proteome not as H; AGC300%. b Volcano plots of number of PSMs accurately quantified with selected TMT channels. N number of PSMs. The dash lines indicate cutoffs in fold change and p-values. c Abundance distribution (upper panel: boxplot; lower panel: scatter plot) of regulated and non-regulated yeast peptides. The Y-axis displays SN values of channel 133 N which represents the highest abundance of yeast peptides. In both b and c calculations of numbers were the same as a. PSMs with log2-fold change higher than 0.5 at p < 0.05 were designated as regulated.

