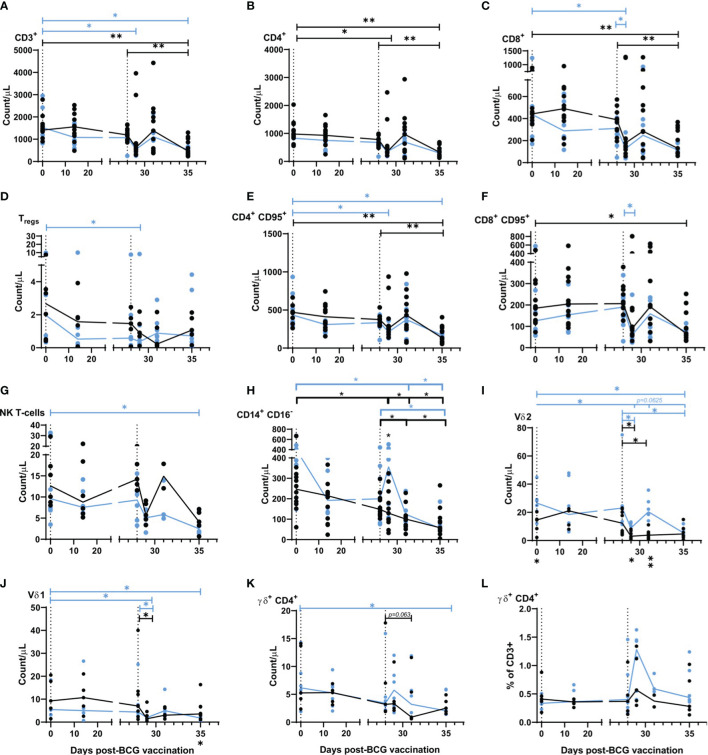
Figure 3.
Immunophenotyping applied to whole blood before, and after aerosol BCG vaccination and SARS-CoV-2 challenge. (A) CD3+ T-cells, (B) CD4+ T-cells, (C) CD8+ T-cells, (D) Tregs, (E) CD4+ CD95+ T-cells, (F) CD8+ CD95+ T-cells, (G) NK T-cells, (H) CD14+ CD16+ monocytes, (I) Vδ2 cells, (J) Vδ1 cells, (K) γδ+ CD4+ cells, (L) γδ+ CD4+ cells as a proportion of CD3+ cells. All cell populations shown as counts/µl. Group medians are shown with data from individual animals represented by a dot. Blue = BCG vaccinated (n = six), black = unvaccinated (n = 12 or six, reducing to 11 and five post challenge). Significant differences determined by the Wilcoxon signed-rank test for comparisons within groups (colour coded by group) and Mann–Whitney U-test for comparisons between groups are denoted by asterisks. *p ≤ 0.05, **p = 0.01.

