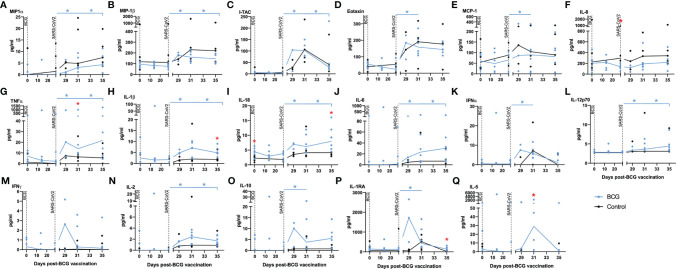
Figure 4.
Chemokine markers in serum by multiplex bead array assay. Plots show titres of selected chemokine markers measured in serum samples collected from individual animals with group median values plotted as lines. (A) MIP-1α, (B) MIP-1β, (C) I-TAC, (D) eotaxin, (E) MCP-1, (F) IL-8, (G) TNF-α, (H) IL-1β, (I) IL-18, (J) IL-6, (K) IFNα, (L) IL-12p70, (M) IFN-γ, (N) IL-2, (O) IL-10, (P) IL-1RA, (Q) IL-5. Aerosol BCG vaccination and SARS-CoV-2 challenge are indicated by dotted lines. Asterisks indicate significant differences between pre- and postinfection values (colour coded to vaccination group) measured by the Wilcoxon matched-pair test. Red asterisks indicate significant differences between the groups determined by the Mann–Whitney U-test (p ≤ 0.05).

