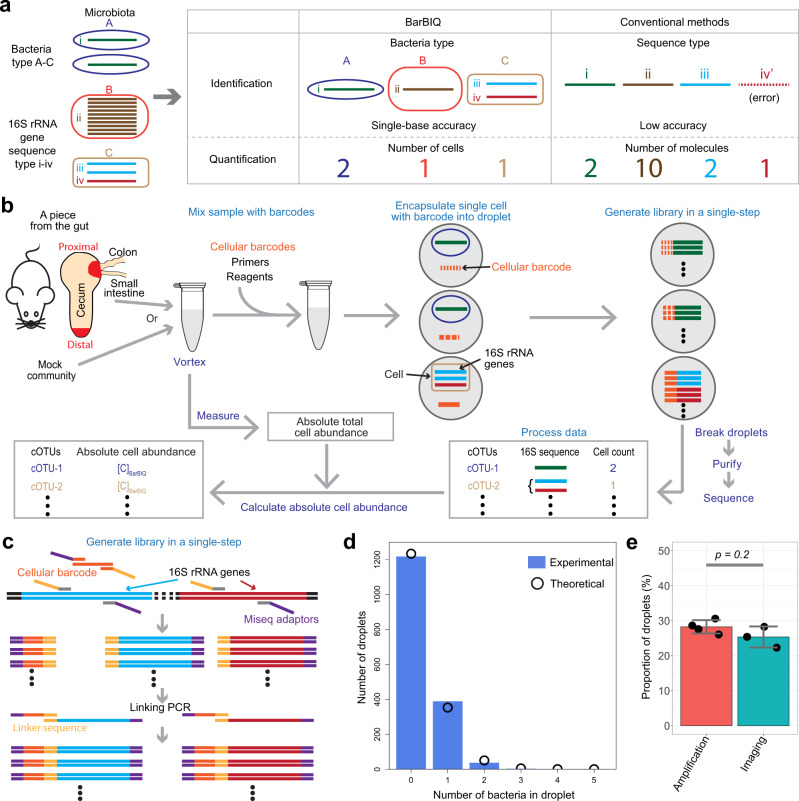
Fig. 1. BarBIQ and its quality controls.
a Main concept of BarBIQ and its comparison with conventional 16S rRNA gene-amplicon sequencing methods. b Schematic of BarBIQ. After the sample was suspended in a solution, vortexing was performed to break the clumps of bacteria. Cellular barcodes, DNA molecules containing random bases and primed sites for amplification; primers, DNA primers for amplification of both 16S rRNA genes and cellular barcodes, for linking both amplified products, and for attaching sequencing adapters; reagents, reagents for DNA amplification. Details for the schematics for library generation, purification, and sequencing are shown in Supplementary Fig. 4, and details for the data processing are shown in Supplementary Fig. 5. c Schematic of the library generation in a droplet. Both a cellular barcode and 16S rRNA genes (V3–V4 region, ~450 bases) in a bacterial genome in a drop were initially amplified by primers containing sequencing adapters and a linker sequence. Subsequently, the amplified barcodes were linked36 with the amplified 16S rRNA genes via the linker sequence. The DNA length is not to scale. d Comparison between the distribution of the number of bacteria in droplets (bars) observed by microscopic imaging (Supplementary Fig. 2) and the theoretical distribution (dots) calculated based on Poisson distribution. e Comparison between the proportion of droplets in which the 16S rRNA gene(s) in bacteria were amplified by ddPCR (Supplementary Note 1) and the proportion of droplets in which bacteria were observed by microscopic imaging (Supplementary Fig. 2); the droplets for both experiments were generated with the same cecal sample and with the same dilution factor. Data are presented as mean values ± SD (n = 4 for amplification, n = 3 for imaging). P value was calculated by the Kruskal-Wallis rank-sum test. Source data for (d) and (e) are provided as a Source Data file.

