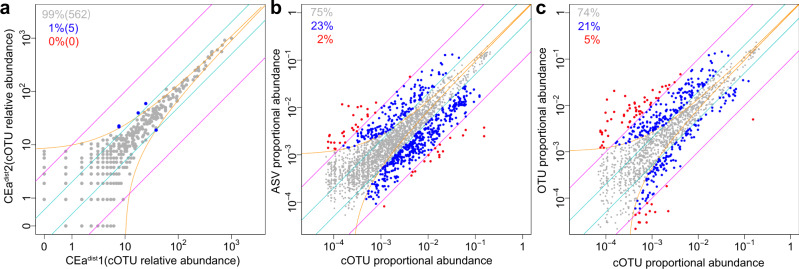
Fig. 4. Highly reproducible quantification of BarBIQ and comparison with conventional methods.
a Comparison (dots) of the relative abundances of cOTUs between a pair of technical replicates (other pairs in Supplementary Fig. 12). Orange lines, theoretical confidential interval (99.9%) for sampling noise based on the Poisson distribution and normalization to the relative abundance (to the proportional abundance for b and c); cyan lines, 2-fold change; magenta lines, 10-fold change; blue dots, cOTUs that showed larger difference than that of the sampling noise and 2-fold change and was smaller than the 10-fold change; proportions and numbers in the parentheses, proportions and the numbers of dots in corresponding colors, respectively; CEa, mouse; dist and prox, locations; 1 and 2, technical replicates (see text). b Comparison between the proportional abundances of the common pairs of cOTUs and ASVs with all 16 cell-samples shown in the same format as a. Red dots, common pairs of cOTUs and ASVs that showed larger difference than the sampling noise and 10-fold change. c Comparison between the proportional abundances of the common pairs of cOTUs and OTUs with all 16 cell-samples shown in the same format as a and b. Source data are provided as a Source Data file.

