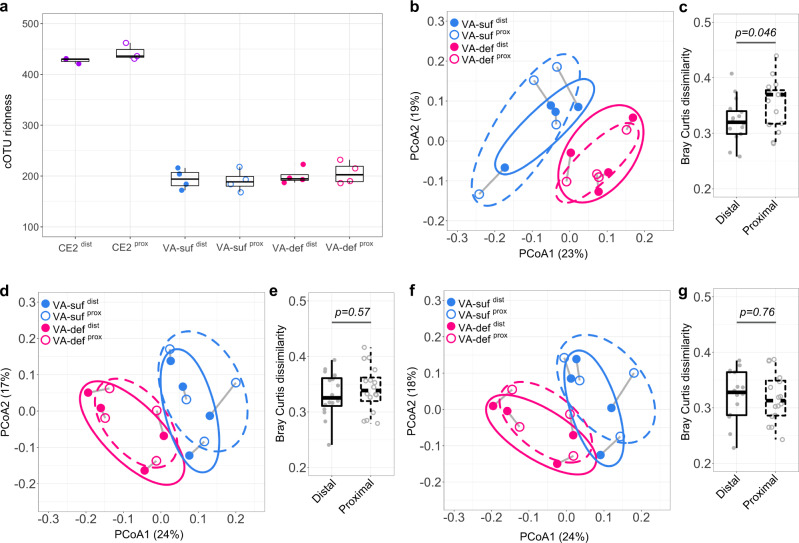
Fig. 5. cOTU richness and Bray-Curtis dissimilarity of the murine cecal microbiotas.
a The cOTU richness of each cell-sample determined by subsampling 6608 cells using the function rarefy in the R package Vegan. CE2, CE2 nutriment group; VA-suf, VA-sufficient group; VA-def, VA-deficient group; dist and prox, locations. b, d, and f, Principal coordinate analysis (PCoA) of Bray-Curtis dissimilarities calculated based on the relative cell abundances of cOTUs (b), ASVs (d), and OTUs (f) between each pair of cell-samples in the VA group. Labels, same as (a); gray line, linkage from the same mouse; circles, 95% confidence ellipses for each group. c, e, and g, Quantitative comparison of Bray-Curtis dissimilarities in b, d, and f, respectively. Distal, all possible pairs from VA-sufdist and VA-defdist, respectively; Proximal, all possible pairs from VA-sufprox and VA-defprox, respectively. Boxes in a, c, e, and g represent 25th to 75th percentiles (the interquartile range), horizontal black lines indicate medians, and whiskers show 1.5 times the interquartile range (n = 3 for CE2dist and CE2prox; n = 4 for VA-sufdist, VA-sufprox, VA-defdist, and VA-defprox; n = 16 for Distal and Proximal). P values were calculated by the Kruskal–Wallis rank-sum test. Source data are provided as a Source Data file.

