
Fig. 6. Comparison of location-dependent relative cell abundance in each mouse.
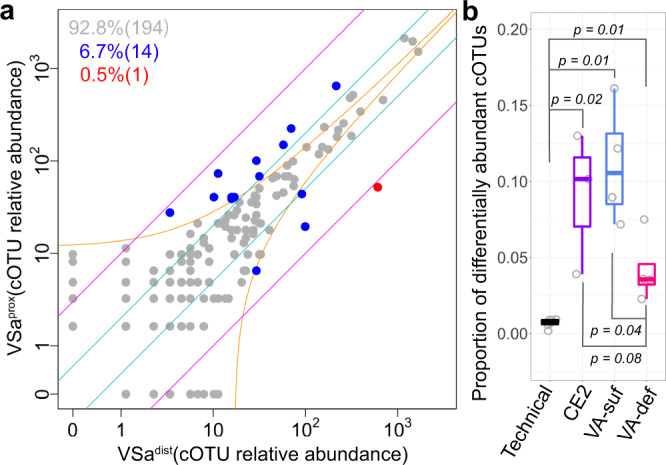
a Comparison between the relative cell abundances of cOTUs detected from the distal location and proximal location of the mouse VSa, shown in Fig. 4a (other mice in Supplementary Fig. 16a). b Proportion of location-dependent differentially abundant cOTUs (differences were larger than the sampling noise and 2-fold) in each mouse. Technical, all pairs from three technical replicates within the distal and proximal locations for the mouse CEa; CE2, the mice in the CE2 nutriment group; VA-suf, the mice in the VA-sufficient group; VA-def, the mice in the VA-deficient group. Boxes represent 25th to 75th percentiles (the interquartile range), horizontal black lines indicate medians, and whiskers show 1.5 times the interquartile range (n = 6 for Technical, n = 3 for CE2, n = 4 for VA-suf and VA-def). P values were calculated by the Kruskal–Wallis rank-sum test. Source data are provided as a Source Data file.