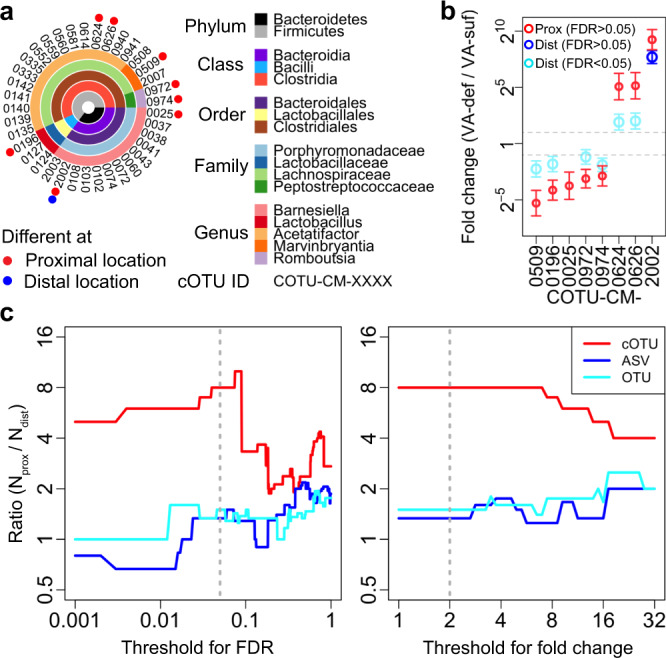
Fig. 7. Differential cell abundance of cOTUs depending on dietary vitamin A deficiency.

a The detected cOTUs and taxonomies (predicted by the RDP classifier, see Methods section). The genera that included at least one differentially abundant cOTU between the VA-sufficient and VA-deficient groups at either the distal or proximal location are shown (other in Supplementary Data 8). Different, FDR < 0.05 and fold change > 2. b The estimated fold changes (dots) and standard errors (error bars, n = 4) by DESeq2 between the VA-sufficient group (VA-suf) and VA-deficient group (VA-def) of the differentially abundant cOTUs (FDR < 0.05, fold change > 2) at either distal (Dist) or proximal (Prox) location. The differential analysis of COTU-CM-0025 at the distal location was not performed since its abundances were too low (Methods section). c The ratio between the number of differentially abundant cOTUs, ASVs, or OTUs at the proximal location (Nprox) and at the distal location (Ndist) as a function of threshold for FDR (left) and for fold change (right). FDR < 0.05 and a fold change > 2 (gray dotted lines) were considered “significant differences” in other analyses. Source data for (b) and (c) are provided as a Source Data file.
