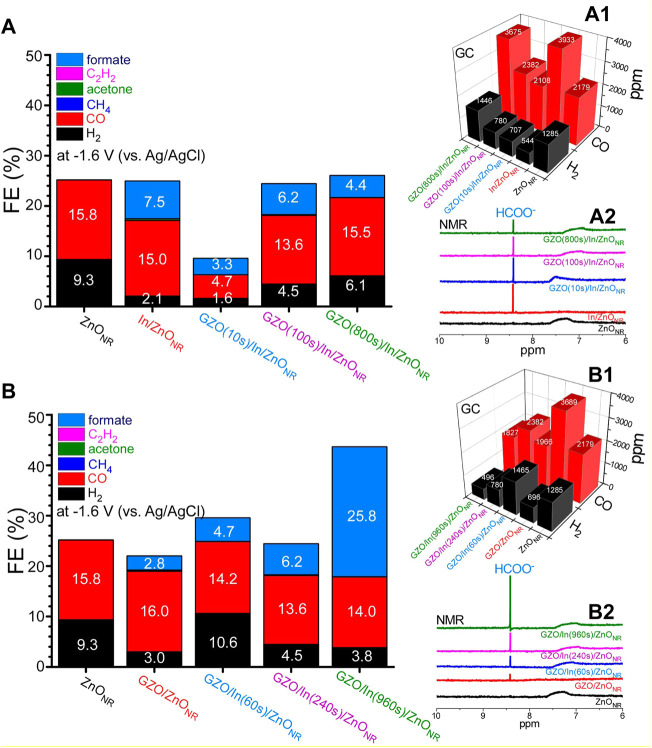
FIGURE 3.
Electrochemical CO2 reduction FE(%) (A), ppm amounts of H2 and CO (A1), and the corresponding NMR data (A2) for ZnONR, In(240s)/ZnONR, and GZO/In(240s)/ZnONR with GZO thicknesses of 10, 100, and 800 s at −1.6 V (vs. Ag/AgCl). FE (%) (B), ppm amounts of H2 and CO (B1), and the corresponding NMR data (B2) for ZnONR, GZO(100s)/ZnONR, GZO(100s)/In/ZnONR with In thicknesses of 60, 240, and 960 s at −1.6 V (vs. Ag/AgCl).

