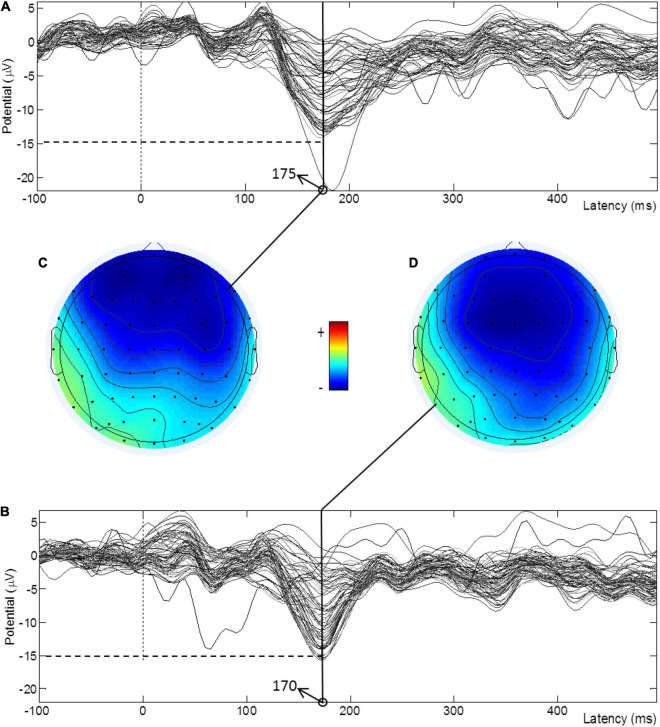
FIGURE 3.
TDS-evoked MMN waveforms of all electrodes pre- and post-treatment for a subject in the atDCS group and the amplitude brain topographies at the peak moments. (A) MMN waveform before treatment. (B) MMN waveform after treatment. (C) Peak amplitude topographic map before treatment. (D) Peak amplitude topographic map after treatment.

