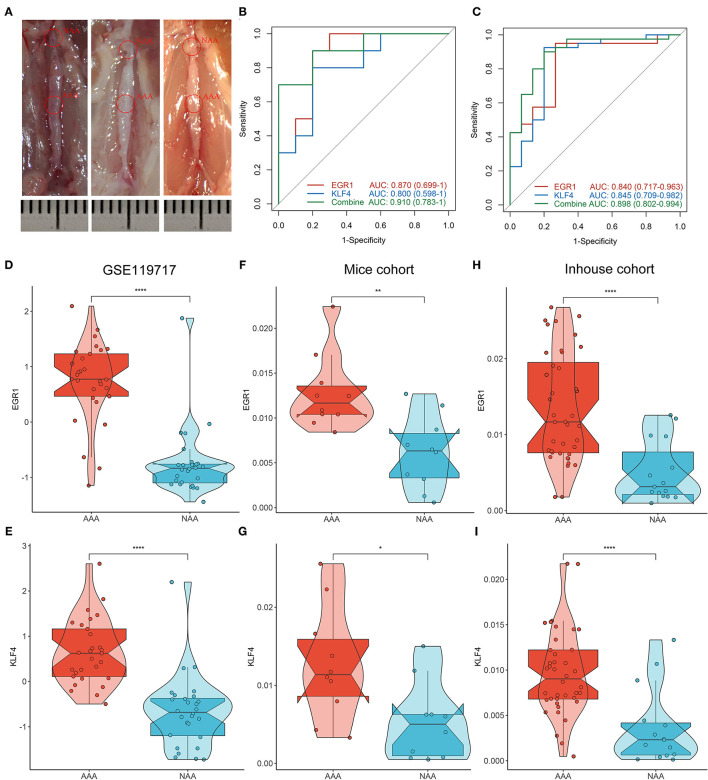
Figure 6.
Validation of biomarkers in mice and inhouse cohorts. (A) Construct the AAA mice model. (B,C) The ROC curve of the diagnostic markers in the mice (B) and inhouse (C) cohorts. (D–I) Differential analysis of gene expression of EGR1 and KLF4 in the three cohorts. *p < 0.05; **p < 0.01; ***p < 0.001; ****p < 0.0001.

