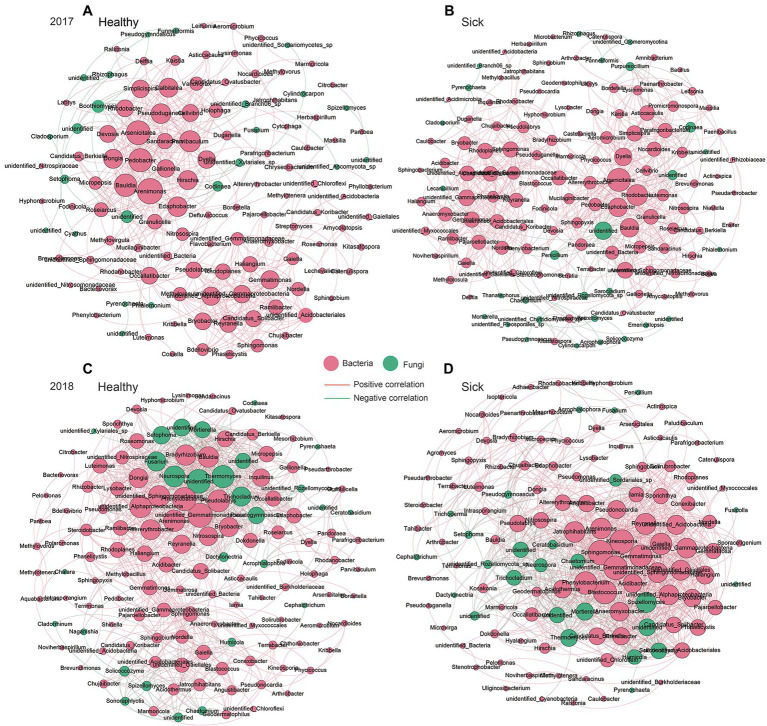
Figure 6.
Co-occurrence network relationship between the healthy group and the sick group. (A) Healthy tobacco in 2017. (B) Sick tobacco in 2017. (C) Healthy tobacco in 2018. (D) Sick tobacco in 2018. Screen the correlation greater than 0.8, p < 0.05. The red edges represent bacteria, and the green edges represent fungi, the red lines between the nodes indicate a positive correlation, and the green lines indicate negative correlation.

