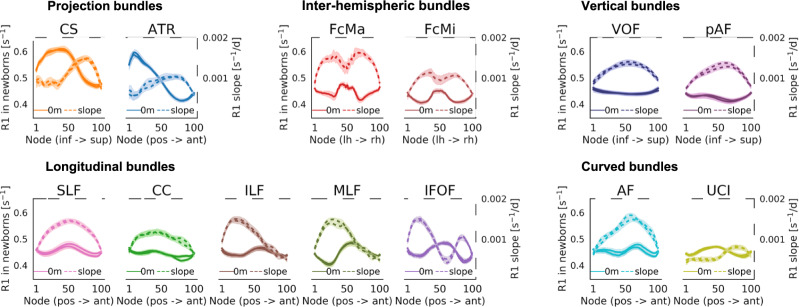
Fig. 4. R1 development rate varies along the length of each bundle.
a Each panel jointly shows measured R1 in newborns (left y-axis, solid line) and the slope of R1 development (right y-axis, dashed line) at each node along the bundle. Higher R1 in newborns corresponds to higher values in solid lines. Faster development (more positive slope) corresponds to higher values in dashed lines. Lines from both hemispheres are presented separately but fall on top of each other. Shaded regions indicate standard error of measured R1 in newborns or slope of R1 development, respectively. Source data are provided as a Source Data file. CS cortico-spinal tract, ATR anterior thalamic radiation, FcMa forceps major, FcMi forceps minor, VOF vertical occipital fasciculus, pAF posterior arcuate fasciculus, AF arcuate fasciculus, UCI uncinate fasciculus, SLF superior longitudinal fasciculus, CC cingulum cingulate, ILF inferior longitudinal fasciculus, MLF middle longitudinal fasciculus, IFOF inferior frontal occipital fasciculus.

