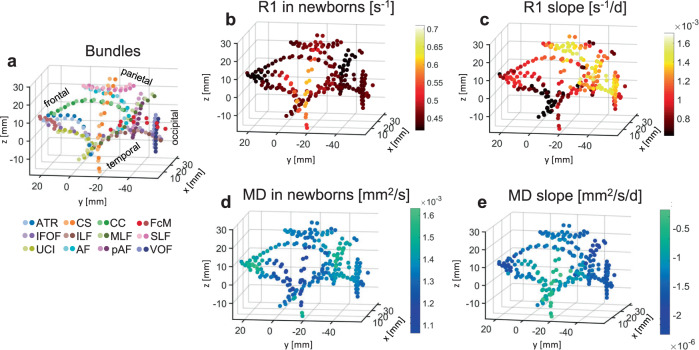
Fig. 5. Spatial gradients and measurements at birth together explain R1 and MD development.
In all panels, each point is a node. In all plots only every 10th node of a bundle is plotted to ensure spatial independence of tested nodes. The coordinate of each node is the average |x|,y,z coordinate across newborns. As all data were acpc-ed, the 0,0,0 coordinate is the anterior commissure; |x|-axis is medial to lateral; y-axis is posterior to anterior; z-axis is inferior to superior. The axes are identical across panels. a 3D spatial layout of the 24 bundles in the average newborn brain volume. Nodes are color-coded by bundle (see legend, darker shades for left hemisphere); approximate lobe annotations are included to clarify the spatial layout. b 3D spatial layout of measured R1 at each node in newborns. Data are averaged across participants. Color indicates R1. c 3D spatial layout of R1 development rate (i.e., the slope estimated from LMM) at each node. d 3D spatial layout of measured MD at each node in newborns. Data are averaged across participants. Color indicates MD. e 3D spatial layout of MD development rate (i.e., the slope estimated from LMM) at each node. Source data are provided as a Source Data file. CS cortico-spinal tract, ATR anterior thalamic radiation, FcMa forceps major, FcMi forceps minor, VOF vertical occipital fasciculus, pAF posterior arcuate fasciculus, AF arcuate fasciculus, UCI uncinate fasciculus, SLF superior longitudinal fasciculus, CC cingulum cingulate, ILF inferior longitudinal fasciculus, MLF middle longitudinal fasciculus, IFOF inferior frontal occipital fasciculus.

