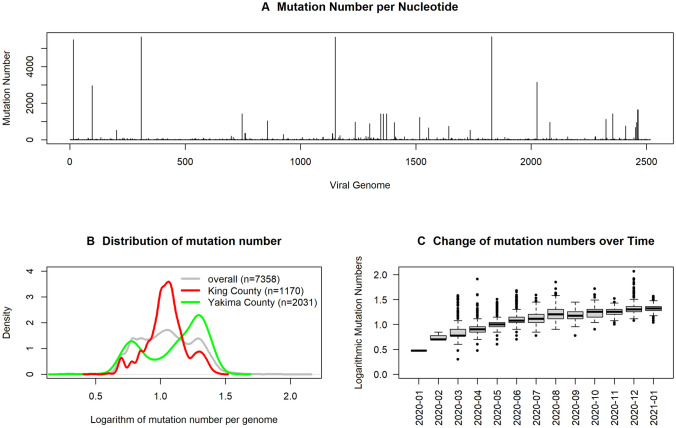
Figure 1.
Results from analyzing 7137 viral genomes sequenced by laboratories in Washington state and deposited to GISAID. (A) Results from counting mutational numbers per nucleotide throughout the viral genome. Upper arrow indicates observed counts greater than 300. The viral genome is annotated with gene designations immediately below. (B) Computed q-values and maximum values of variant proportions in November 2020, December 2020, and January 2021, obtained from fitting generalized linear models to all individual SNVs. SNVs exceeding established threshold q-value and maximum proportions are highlighted in red (upper right corner). (C) Eight selected SNVs with significant and substantial temporalities are mapped using their locally averaged variant proportions over time from fitted generalized linear models (color key upper left).

