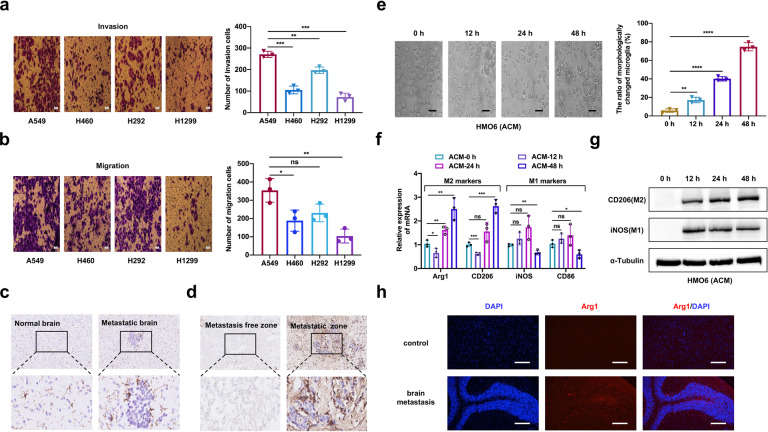
Fig. 1.
Human NSCLC A549 cells alter phenotype of microglia. a Evaluating the ability of invasion in different cell lines by Transwell invasion assay (magnification, 400×). b Evaluating the ability of migration in different cell lines by Transwell migration assay (magnification, 400×). c Representative images of IHC staining with IBA-1 (brown) and nuclear counterstaining with hematoxylin (blue) were depicted. Left image was from a control mouse and the right image was brain specimens of a mouse with brain metastasis. Top panels: magnification was 200×. Bottom panels were with higher magnification (800×). d Human specimens of NSCLC-BM showing metastasis free and positive areas, metastatic zone was surrounded with activated IBA-1+ microglia cells. Top panels: magnification was 200×. Bottom panels were with higher magnification (800×). e Morphologic changes of HMO6 cells treated with ACM for 0 h, 12 h, 24 h, 48 h were evaluated by phase-contrast microscopy (magnification: 400×). f The relative expression of M1-markers (iNOS and CD86) and M2-markers (Arg1 and CD206) mRNA in HMO6 cells treated with ACM for 0 h, 12 h, 24 h, 48 h are detected by quantitative RT-PCR. β-Actin was used to normalize gene expression. g Western blot and the corresponding gray value analysis were used to investigate the expression iNOS and CD206 in HMO6 cells cultured in ACM for 0, 12, 24, 48 h. h Representative images of immunofluorescence staining with DAPI (blue) for nuclei and Arg1(red) for M2-marker were depicted (magnification: 20×). ACM: A549 cells-conditioned media. Data are mean ± SD. P > 0.05 no significant difference; *P < 0.05; **P < 0.01; ***P < 0.001; ****P < 0.0001

