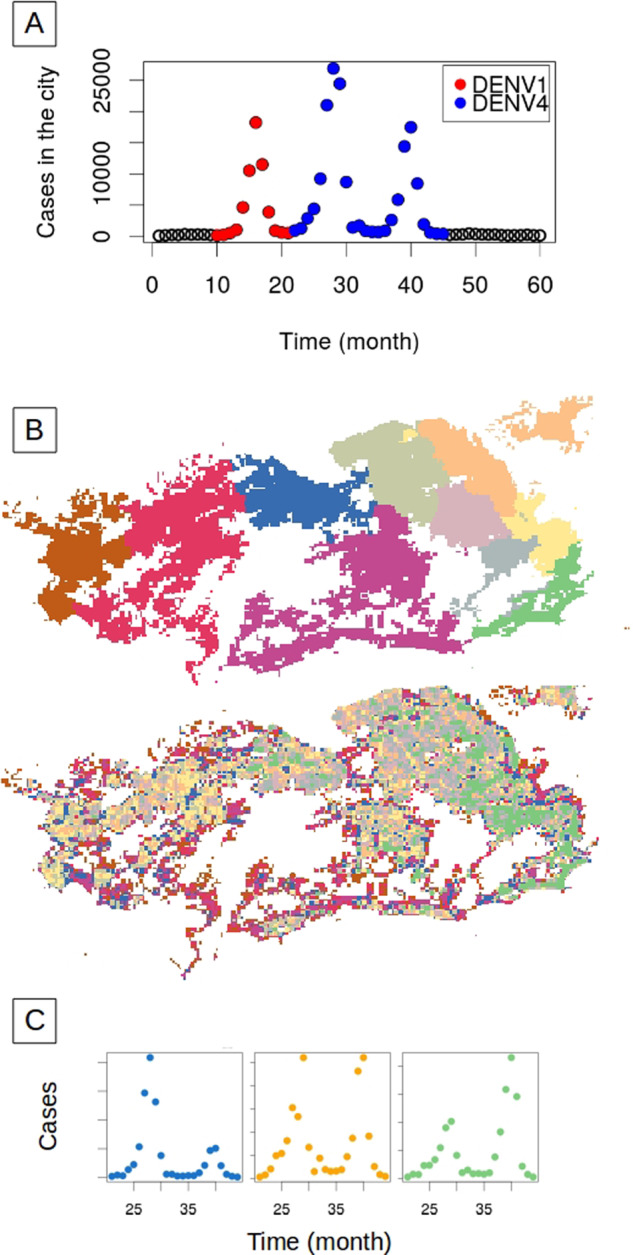
Fig. 1. Dengue incidence patterns in Rio de Janeiro city.

A Total monthly cases of dengue reported in the city from January 2010 to December 2014. Red and blue dots correspond, respectively, to outbreaks with two different dominant serotypes, DENV1 and DENV4, with the latter making its first emergence in Rio de Janeiro. Black circles indicate seasons without outbreaks and only a small number of cases. B The maps illustrate the geography of the city when 250 m by 250 m units are aggregated into 10 strata by administrative regions (top) or population density—number of individuals in an area of 250 m by 250 m—(bottom) (see Supplementary Fig. 6 for the population density map with the scale reference). C Examples of three different possible patterns for the relative size of the peaks and therefore, peak ratio, for DENV4 incidence in three of the 10 administrative regions shown in the upper map in (B). The colors indicate the corresponding regions in this map.
