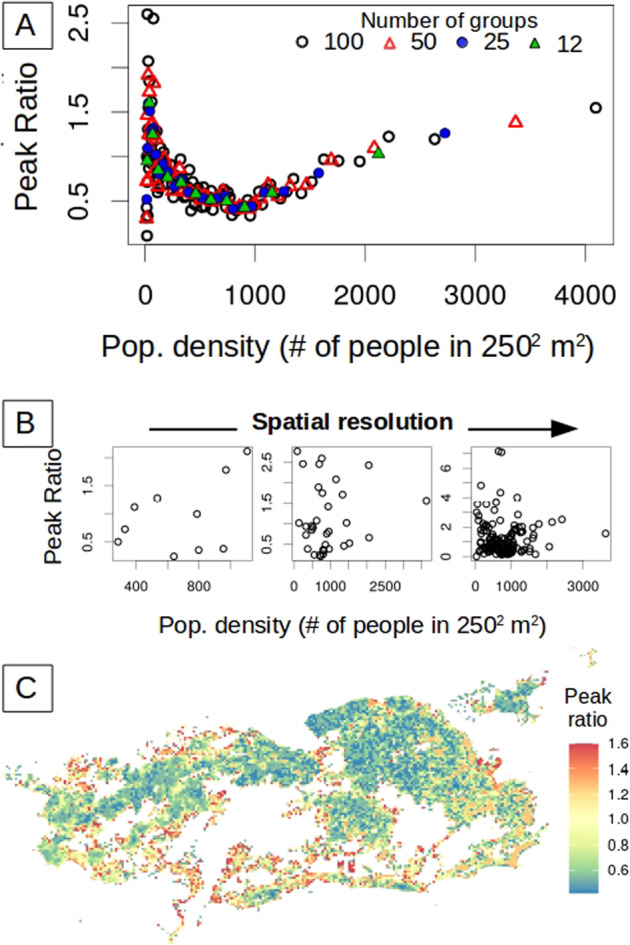
Fig. 2. Ratio between the size of the successive peaks of DENV4.

The ratio for the size of the second epidemic over the first one was computed for each spatial location given different resolutions and the two different ways to aggregate space. In (A), the 250 m by 250 m units are aggregated according to their population density. In this case, the peak ratio exhibits a clear but nonlinear relationship with human density (see Supplementary Fig. 8D for a log scale representation). The colors correspond to partitions of the city into different numbers of groups. The pattern is invariant to the number of groups (resolution). In (B), space is subdivided according to the typical geographical partition into administrative units based on contiguous space. The city of Rio de Janeiro is administratively subdivided into different resolutions, namely 10 or 33 administrative regions (Fig. 1B and Fig. S7B, respectively) and 160 neighborhoods (Supplementary Fig. 7C). For any of these partitions, no relationship is observed between peak ratio and population density, as illustrated here for the three spatial scales of established administrative subdivisions of the city (from left to right: 10, 33, and 160 regions). In (C), the heterogeneity in peak ratio across the city is illustrated at the finest spatial resolution. The peak ratio spans a range of values, from below to above one (from blue to red), corresponding, respectively, to locations with a second peak smaller than the first one, and vice-versa. This fine-scale heterogeneity in peak ratio across space reflects that of population density (Supplementary Fig. 6).
