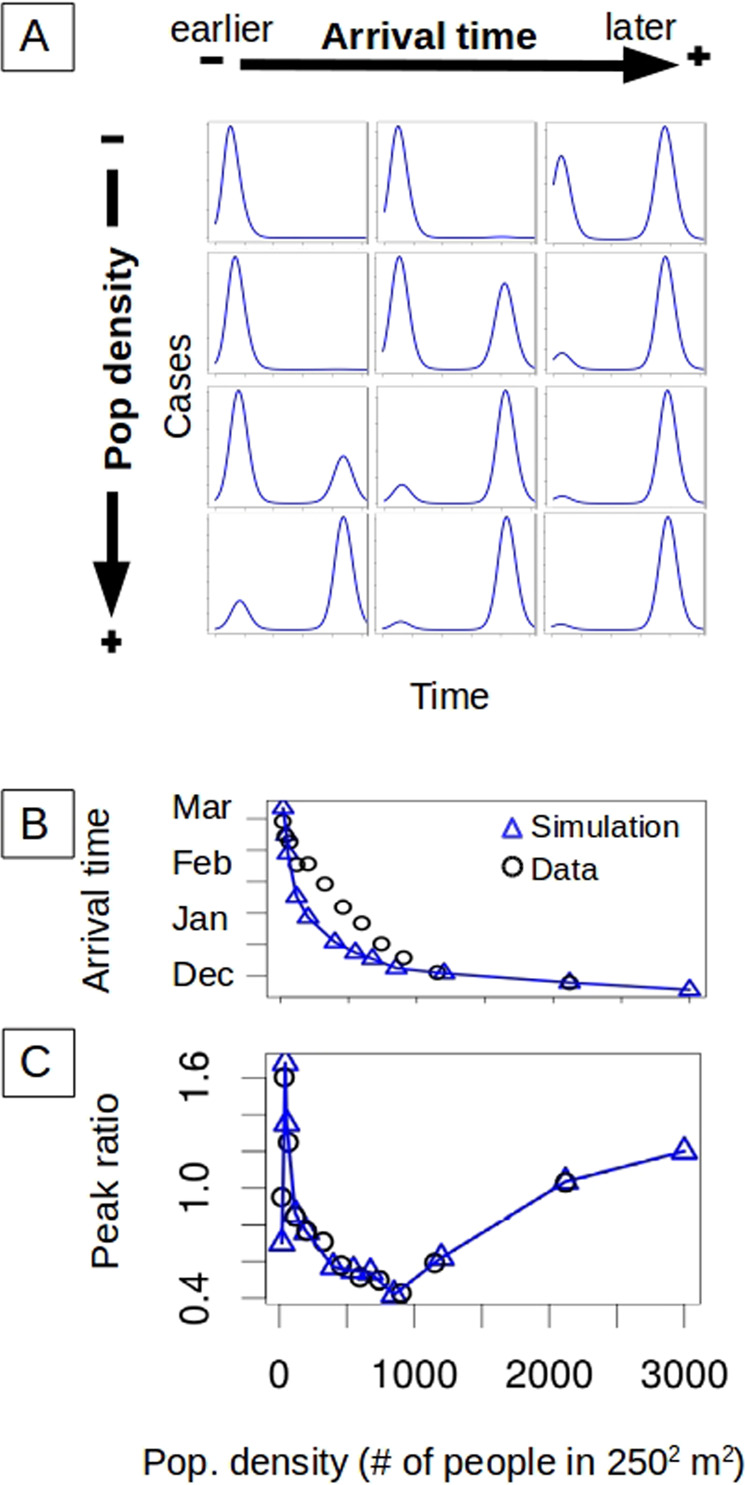
Fig. 3. Deterministic SIR (susceptible–infected–recovered) dynamics and successive epidemic size.

A The temporal incidence of a unit is shaped by human density directly, but also indirectly via the arrival time of the first imported infection (the y-axis is normalized by the maximum value of cases for better visualization). The temporal dynamics are simulated with a deterministic SIR model with a seasonal transmission rate. For a given arrival time, the size of the second peak increases with the population density of the unit (top to bottom). The earlier the first infection reaches the unit, the smaller the size of the second peak (left to right). B Importantly, denser units are infected earlier (data: black circles). The blue triangles are used as input to the model to specify arrival time and therefore initial conditions in a given unit (with an exponential decay curve capturing the observed trend). The earlier importation of infection in denser units implies two opposite effects of population density on relative peak size (demonstrated in A). C For arrival times similar to those observed in the data, the model simulations (blue triangles) can capture the observed behavior (black circles) of the peak ratio with human density. The results correspond to a partition of the city into 12 groups according to population density.
