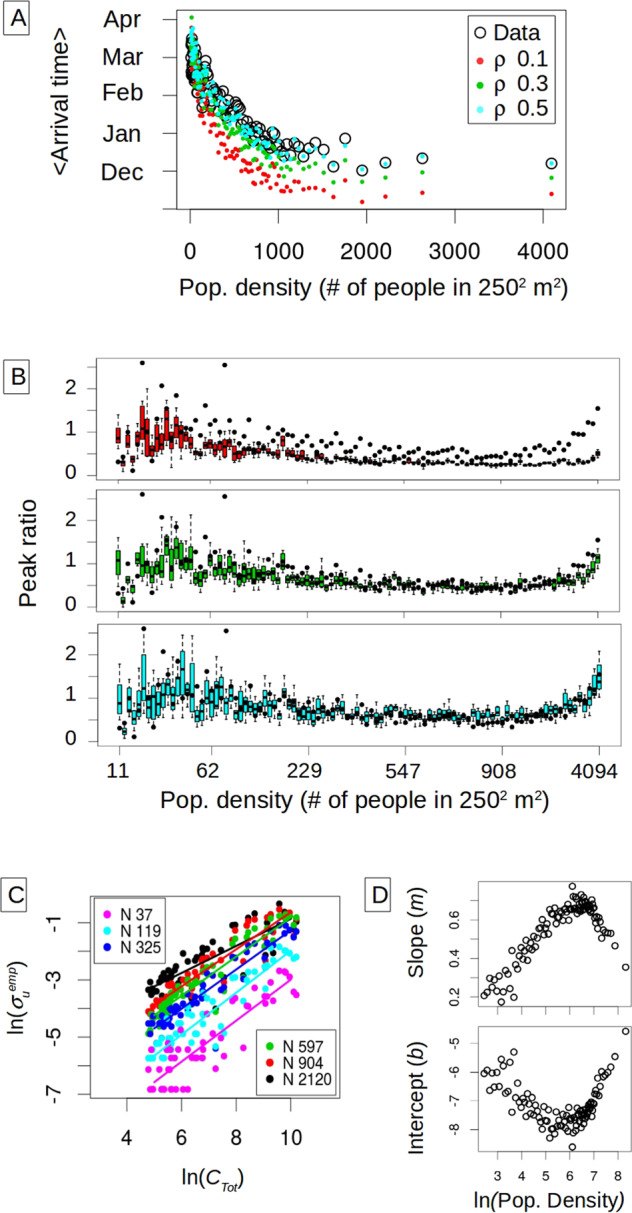
Fig. 4. Stochastic simulations and empirical “spark” rate (number of sparks per month per unit).

A Mean observed arrival time as a function of human density. The original units are binned into 100 groups and arrival times are averaged for the units belonging to the same group. The arrival times computed from the data (black circles) are compared to those obtained in model simulations (with dots colored by reporting rate). B Peak ratio obtained in the simulations as a function of population density for the different reporting rates where the colors correspond to those in (A). The boxplots are computed from 20 stochastic realizations (in these, the box illustrates, as is standard, the median with the 25th and 75th percentiles, and the dotted lines indicate the extremes of the distribution). For comparison, the empirical values of peak ratio are also shown (in black, for the 100 groups). C Spark rate as a function of total incidence (CTot). The logarithm of the number of sparks (or number of imported infections) per month per unit exhibits a linear relationship with the logarithm of the total number of cases in the city. The more populated units receive a higher number of sparks as expected in a pattern that is well approximated by a power law. D The parameters of the power relationship between spark rate and total incidence vary as a function of population density. The different slopes (m) and intercept (b) from a linear regression to the log–log plot are shown in (C) as a function of the logarithm of population density. Thus, importation rate to a unit exhibits both a global and a local determinant, namely the total number of cases in the city and the local population in a given unit. These dependencies allow the specification of infection importation via a mean-field coupling and local conditions, circumventing the need to explicitly describe spatial connectivity at fine scales.
