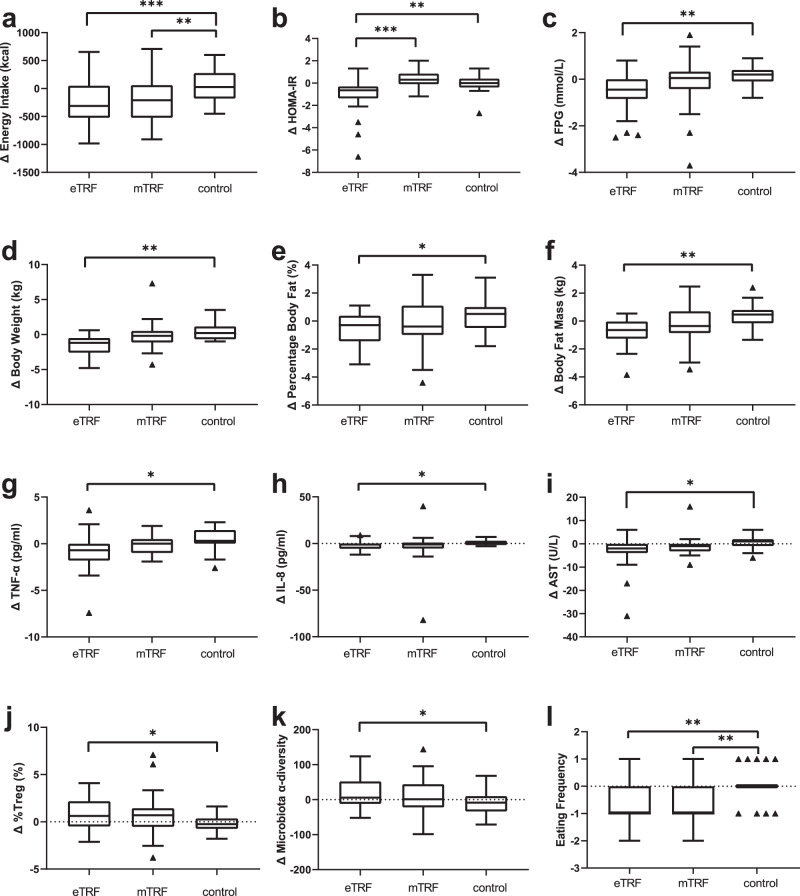
Fig. 2. Energy intake and metabolic health-related parameters.
a Change in daily energy intake after 5 weeks of intervention, ***p < 0.001, **p = 0.009. b Change in insulin resistance index (measured with HOMA-IR) after 5 weeks of intervention, ***p < 0.001, **p = 0.002. c Change in fast plasma glucose (FPG) after 5 weeks of intervention, **p = 0.005; d Change in body mass after 5 weeks of intervention, **p = 0.009. e Change in percentage body fat after 5 weeks of intervention, *p = 0.042. f Change in body fat mass after 5 weeks of intervention, **p = 0.001. g Change in TNF-α (tumor necrosis factor-α) after 5 weeks of intervention, *p = 0.024. h Change in IL-8 (interleukin-8) after 5 weeks of intervention, *p = 0.045. i Change in AST (aspartate transaminase) after 5 weeks of intervention, *p = 0.046. j Change in plasma Tregs (T regulatory cells) after 5 weeks of intervention, *p = 0.038. k Change in gut microbiota α-diversity after 5 weeks of intervention, *p = 0.048. l Change in eating frequency after 5 weeks of intervention, **p = 0.001. n = 28 participants in eTRF group, n = 26 participants in mTRF group, n = 28 participants in control group. Data is visualized as Tukey box plots (line at mean, top of the box at the 75th percentile, bottom of the box at the 25th percentile, whiskers at the highest and lowest values, outliers shown as triangles beyond the whiskers). *p < 0.05, **p < 0.01, ***p < 0.001. One-way repeated measures ANOVA followed by Holm-Sidak’s multiple comparisons test for between group comparisons.

