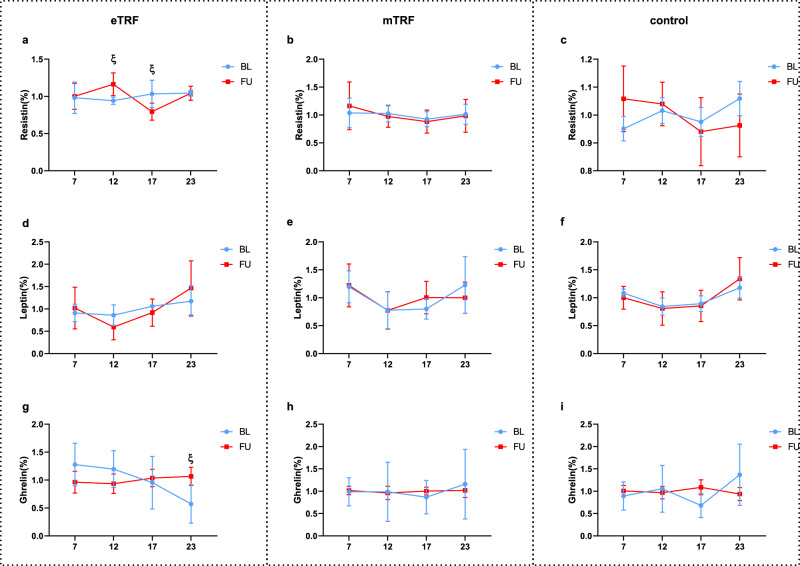
Fig. 3. Only eTRF, but not mTRF, influenced the daily rhythms of plasma adipokine concentrations.
At baseline and at the end of the study, samples were collected from 19 participants (eTRF, n = 5; mTRF, n = 8; and control, n = 6). Plasma adipokine concentrations (resistin, leptin, and ghrelin) were measured at four time points. Two-way ANOVA analysis showed that eTRF (a, d, g) caused significant changes in the resistin concentration at 12:00 (p = 0.048) and 17:00 (p = 0.03) (a), and in the ghrelin concentration at 23:00 (p = 0.037) (g), but mTRF (b, e, h), or control groups (c, f, i) had no significant effects on the rhythm of adipokines. The values at each time point are displayed as the percentage of the mean value across all the time points and are displayed as means ± SEMs. Two-way repeated-measures ANOVA with time of day and feeding regimens as the two independent variables. ξp < 0.05 between baseline and follow-up at that time point. BL baseline, FU follow up.

