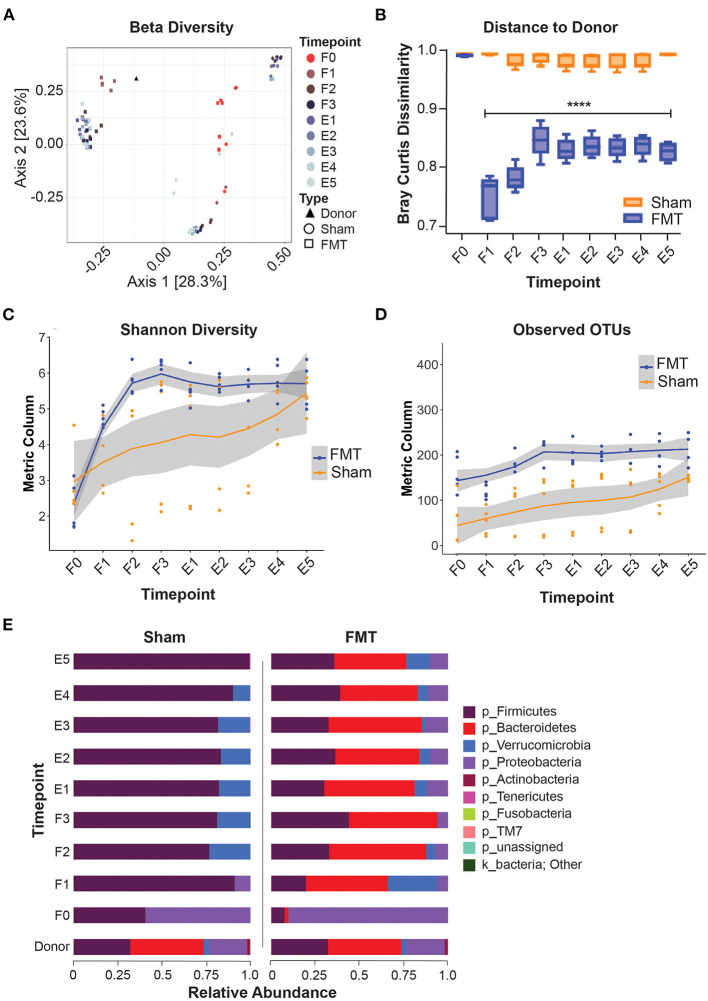
Figure 3.
Microbiome composition shift and engraftment after FMT. (A) PCoA plot showing beta-diversity of different treatment groups. (B) Bray Curtis dissimilarity index comparing distances to donor microbiota. (C,D) Alpha-diversity indices during and after FMT. (E) taxonomy data (Phylum level) showing successful engraftment of donor microbiota. F0–F3: FMT weeks 0–3; E1–E5, Engraftment weeks 1–5; OTUs, operational taxonomic units.

