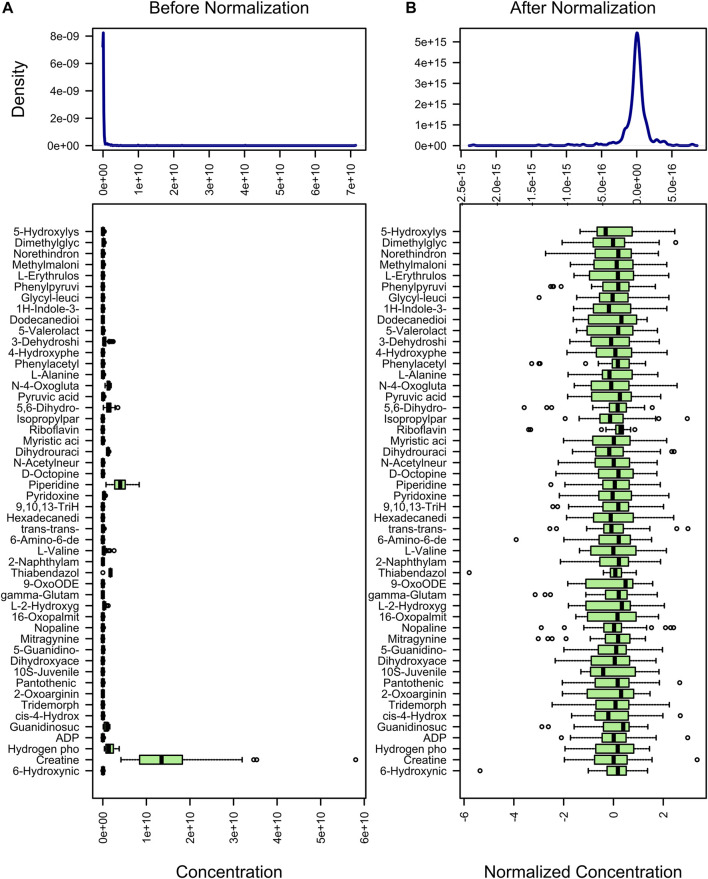
FIGURE 2.
Standardization of metabolites. The content distribution is represented by a box plot, which corresponds to outliers, minimum, lower quartile, median, upper quartile, maximum, and outliers from left to right. The picture on the left is the distribution before normalization, and the picture on the right is the distribution after normalization.

