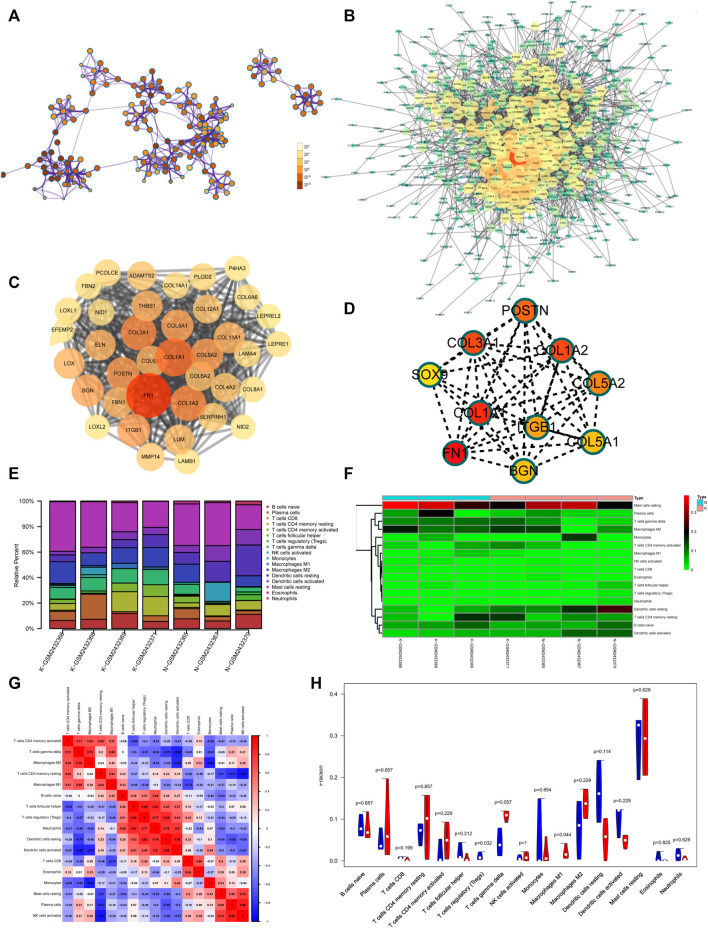
FIGURE 7.
(A) Same enrichment network has its nodes colored by p value, as shown in the legend. The darker the color, the more statistically significant the node is (see legend for p value ranges). (B) The protein–protein interaction (PPI) network of differentially expressed genes of GSE92566. (C) The MCODE algorithm was used to screen the differentially expressed genes and obtain the important genes of pathogenesis using GSE92566. (D) The CytoHubba algorithm was also used to screen the imported genes of GSE92566. (E) Fractions of immune cells between control and keloid tissue in the GEO database (GSE92566). (F) Heatmap of immune cells between control and keloid tissue in the GEO database (GSE92566). (G) A correlational heatmap of immune cells of keloids. (H) A violin plot of immune cells found in control and keloid tissue according to the GEO database (GSE92566); blue denotes normal tissue and red denotes keloid tissue.

