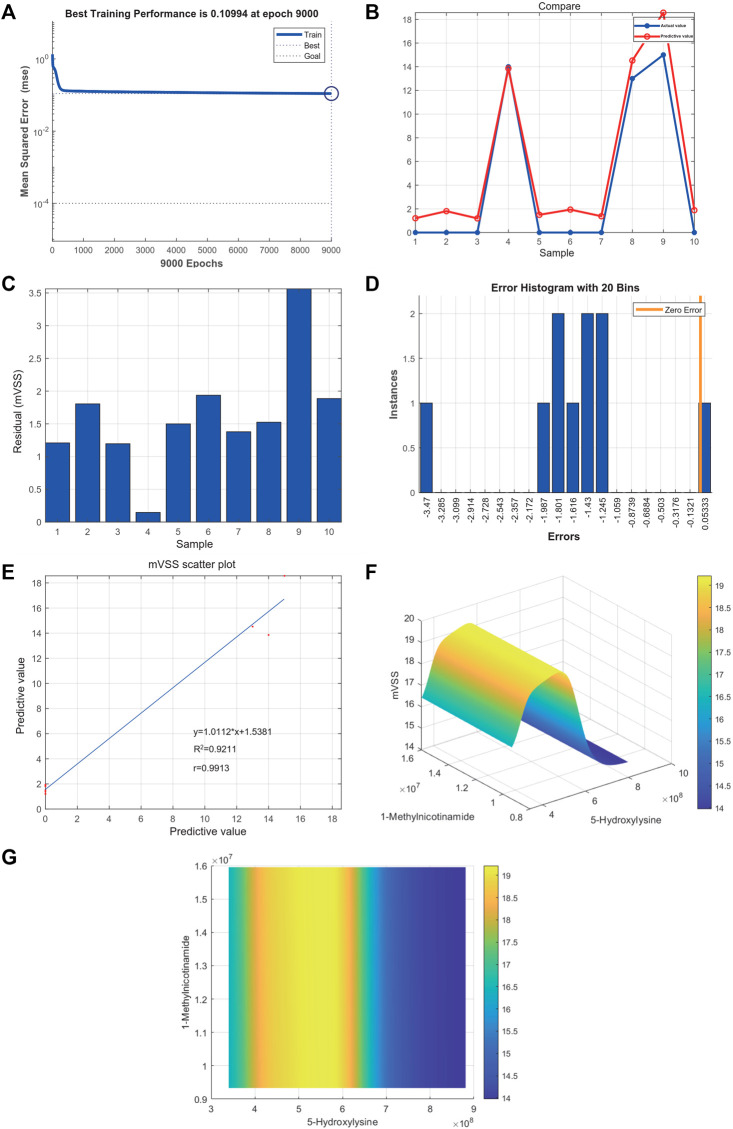
FIGURE 8.
(A) Neural network model for the prediction of keloid severity. (A) The best training performance was 0.10994 at epoch 9,000. (B) The predictive value of the data was verified against the actual value. (C) Absolute error diagram between the predicted value and the actual value of the data. (D) Error distribution map between the predicted value and the actual value of the data. (E) Correlation scatter plot of mVSS. y = 1.0112*x+1.5381, R 2 = 0.9211, r = 0.9913. (F,G) High-risk warning range of 5-hydroxylysine and 1-methylnicotinamide at the planform and three-dimensional levels.

