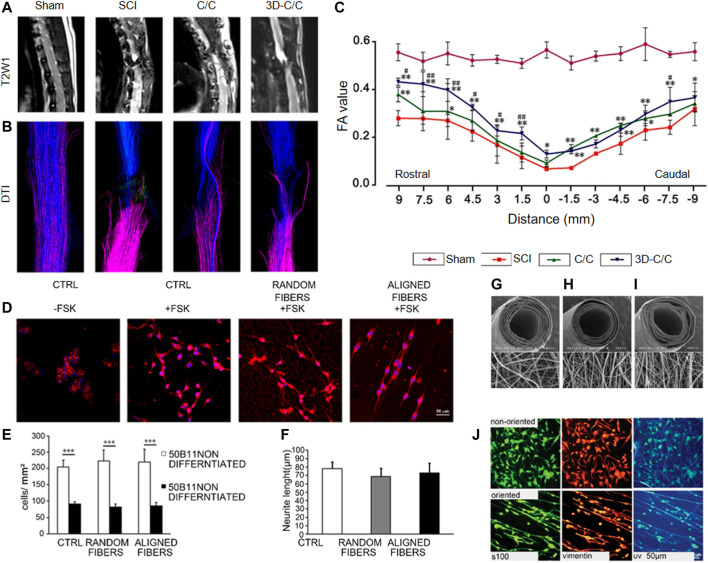
FIGURE 3.
MRI-DTI estimating the recovery of white matter fiber after SCI. (A): T2W1 micrograph of the conventional sagittal spinal cord. (B): DTI-tracked white matter fibers of spinal. (C): The relationship of fractional anisotropy (FA) value and distance (mm). C/C: collagen/chitosan scaffold with freeze drying technology. 3D-C/C: collagen/chitosan scaffold with 3D printing technology. *p < 0.05, **p < 0.01 versus SCI group. # p < 0.05, ## p < 0.01 versus C/C group. Reproduced with permission (Sun et al., 2019). 2019, Wiley. (D) Confocal micrographs of B5011 cells stained by DAPI (blue) and β-tubulin (red) 24 h after different treatments. (E) Comparative 50B11 cell number of different treatment groups. (F) Comparative Neurite length of different treatment groups. FSK: forskolin; ***p ≤ 0.001; Scale bar: 50 μm. Reproduced with permission (Gnavi et al., 2015). Copyright 2015, MDPI. (G) SEM images of electrospun, non-oriented chitosan nanofiber mesh tube. (H) SEM images of electrospun, oriented chitosan nanofiber mesh tube. (I) SEM images of electrospun, bilayered chitosan nanofiber mesh tube. (J) Immunocytochemistry of the immortalized Schwann cell line, IMS32, after culture for 4 days on the nonoriented (upper) and oriented (lower) chitosan nanofiber mesh sheet. Reproduced with permission (Wang et al., 2009). 2008, Wiley.

