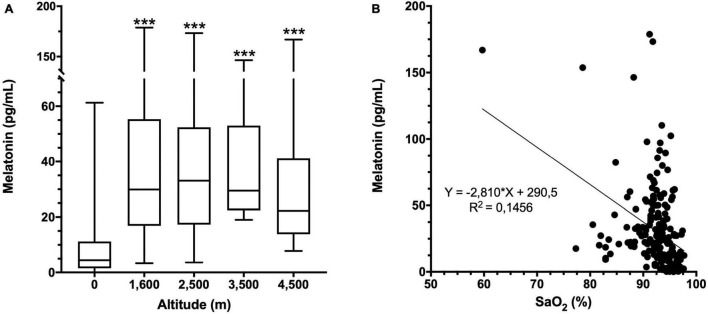
FIGURE 3.
Melatonin concentration and altitude. (A) Melatonin concentration in plasma at each altitude. Data are presented as a box-and-whisker plot. Significant differences: ***p < 0.001 compared to the population at 0 m. (B) Correlation of melatonin concentration with oxygen saturation (SaO2) at all altitudes. Equation and the linear regression R2 are shown.

