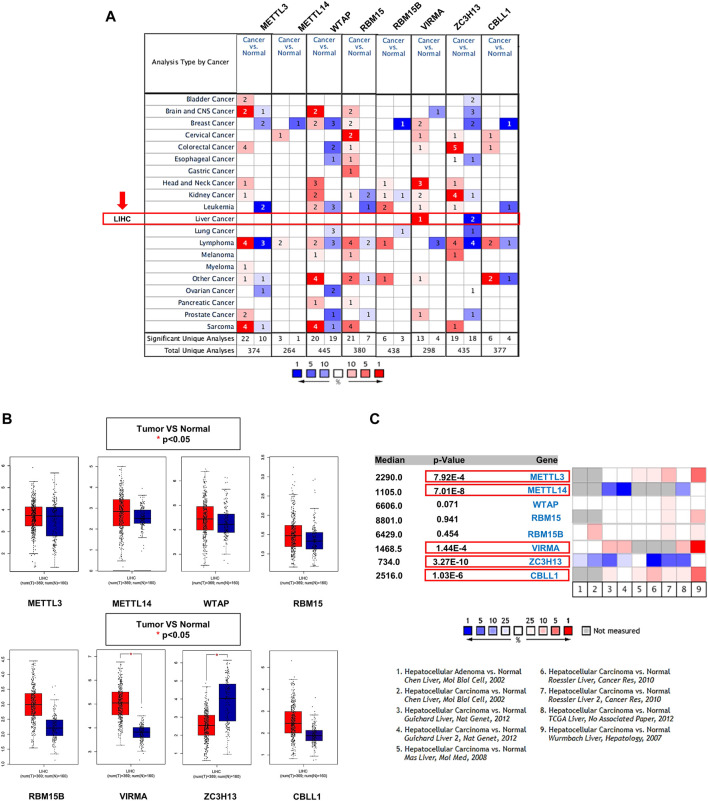
FIGURE 2.
Transcriptional levels of the m6A writer complex in HCC. (A) mRNA expression levels of the m6A writer complex (Oncomine). The box indicated by the red arrow shows liver hepatocellular carcinoma (LIHC). The colored squares represent the median rank of these genes (vs. normal tissue). Red represents high expression and blue represents low expression. Differences in transcriptional expression were compared using Student’s t-test. The cutoff p-value and fold change were as follows: p-value: 0.01, fold change: 1.5, gene rank: 10%, data type: mRNA. (B) Box plot of m6A writer complex expression in HCC (GEPIA). Red represents the expression in HCC tissue, and blue represents the expression in normal tissue. *p < 0.05. (C) Meta-analysis of the mRNA expression levels of the m6A writer complex using the nine Oncomine datasets. The colored squares represent the median rank of these genes (vs. normal tissue) across the nine datasets. Red represents high expression and blue represents low expression. The significance level for the median rank analysis was set at p < 0.05.

