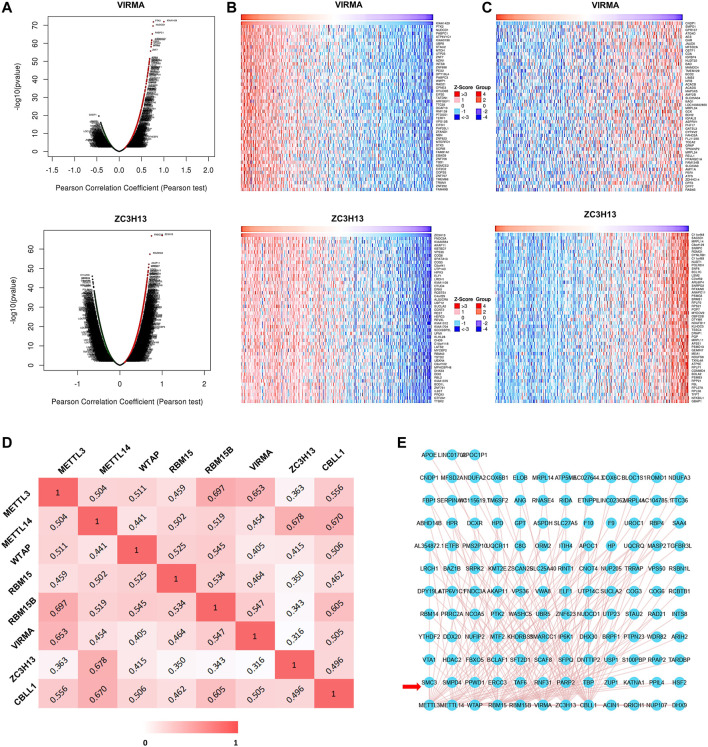
FIGURE 7.
Coexpressed genes and interactions of the m6A writer complex in HCC. (A) Volcano plots show differentially expressed genes related to the m6A writer complex in HCC (LinkedOmics). Heatmaps show the top 50 genes positively (B) and negatively (C) correlated with the m6A writer complex in HCC (LinkedOmics). Red indicates positively correlated genes, and blue/green indicates negatively correlated genes. (D) Heatmap shows mRNA level correlation between the m6A writer-complex components based on Pearson correlation coefficient. (E) Network for the m6A writer complex and its 10 most frequently altered neighboring genes. The red arrow indicates the most frequently altered neighboring genes.

