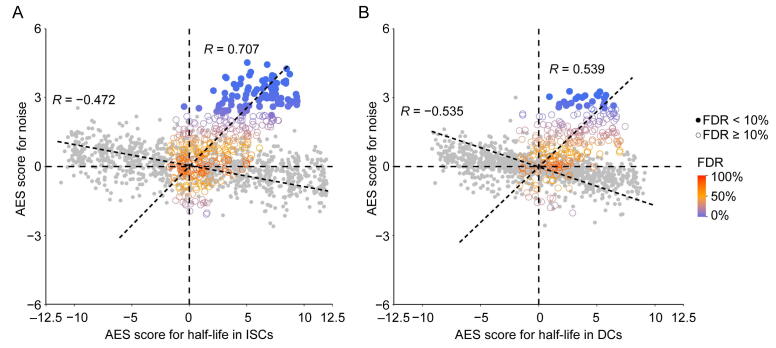
Supplementary figure 12.
The correlation between noise and mRNA half-life. A. and B. Scatterplots of AES scores of gene expression noise versus AES scores of mRNA half-life for random gene sets (gray) and real miRNA target gene sets (color) for ISC (A) and DC (B) datasets. Random gene sets are constructed with varying sample size (200–2000) by weighted sampling of mRNAs according to half-life. In (A), Spearman correlation coefficient between AES scores of half-life and noise for the random sample was −0.472, but was 0.707 for real miRNA target gene sets in ISCs; in (B), Spearman correlation coefficient between AES scores of half-life and noise for the random sample was −0.535, but was 0.539 for real miRNA target gene sets in DCs.

