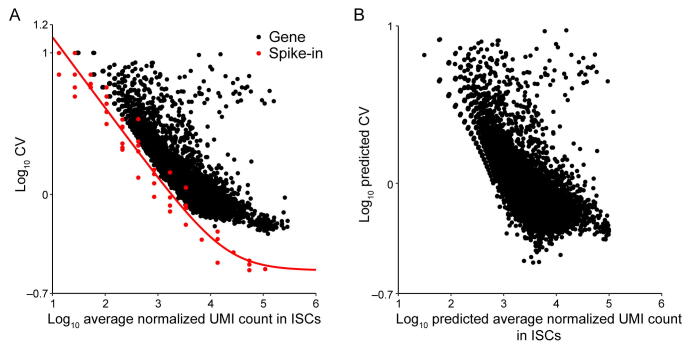
Supplementary figure 18.
Noise quantification and normalization for transcripts in ISCs. A. CV of transcript counts versus average transcript count for all detected genes in raw data from a scRNA-seq experiment in ISCs. Black dots and red dots indicate true genes and spike-ins, respectively. B. Predicted CV of transcript counts versus predicted average transcript count for all detected genes after removing technical noise with the help of spike-ins.

