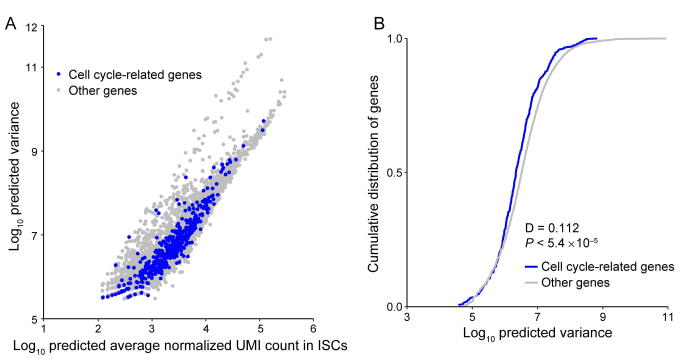
Supplementary figure 21.
Comparison of variance between cell cycle related genes and other genes for ISCs. A. The predicted variance of transcript count versus mean transcript counts across the entire detected genes for ISCs. Cell cycle related genes are highlighted as blue circles. This set of genes consist of all genes containing the “cell cycle” term in whole Gene Ontology terms of “biological process”. B. Compared to the predicted variance cumulative distribution of cell cycle related genes with other genes, cell cycle related genes did not show increased variability and were thus not to lead to false results in the downstream noise analysis.

