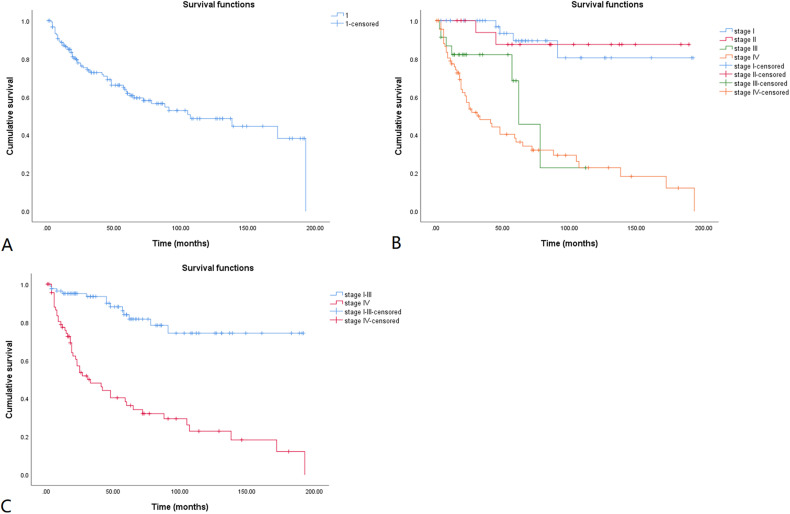
Figure 3.
Kaplan-Meier disease-free survival curve for MTC patients. The cumulative disease-free survival rate is shown in Figure 3A. The cumulative disease-free survival rates calculated according to tumor stages are shown in Figure 3B. Tumor stage I-III is compared with stage IV in Figure 3C. The 5-, 10-, and 15-year cumulative disease-free survival rates were 61.8%, 48.6%, and 38.2%, respectively. MTC patients with stage I-III had significantly longer disease-free survival than those with stage IV (log rank, p < 0.001).

