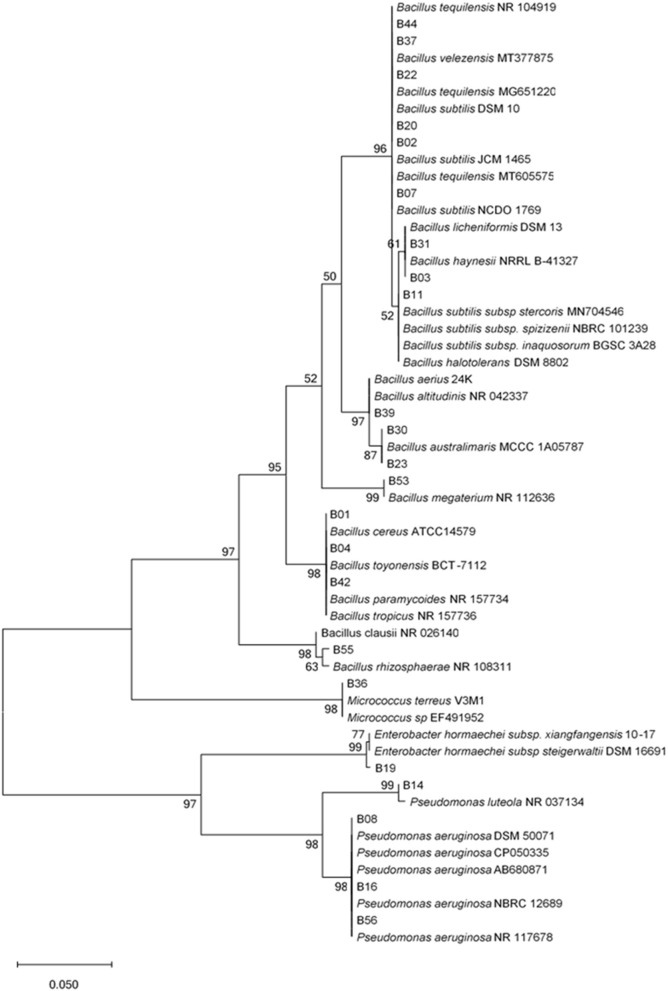
Figure 1.
Unrooted phylogenetic tree of endophytic bacterial 16S rRNA sequences. Evolutionary history was inferred using the Maximum Likelihood method with 1,000 bootstrap replicates in MEGA X software. Scale bar represents 0.05 nucleotide substitutions per site. The percentage of trees in which the associated taxa clustered together is shown next to the branches.

