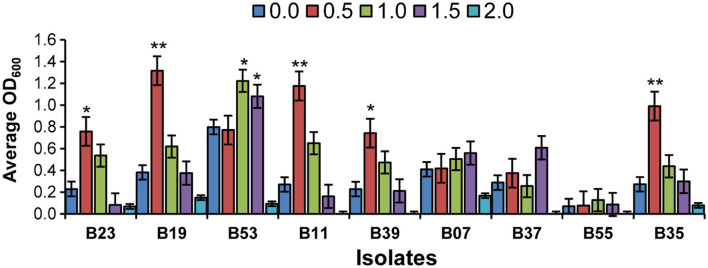
Figure 2.
Effects of salinity stress on the selected bacteria in broth cultures at OD600. Bar chart represents means ± standard error (SE). Asterisk on the top of each error bar depicts significant difference of the OD600 among the different salt concentration in a specific isolate (One-way ANOVA: *P < 0.05, **P < 0.01).

