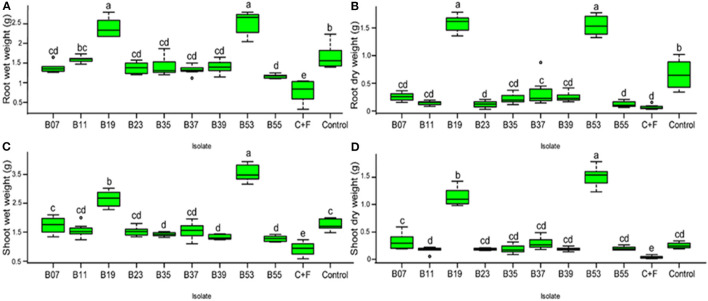
Figure 6.
(A–D) Box plot represent the effect of bacterial endophytic inoculation on bean seedlings in the presence of Fusarium solani on the fresh and dry weights of the roots t and shoot. C+F represents a control with the growth of seedlings without endophyte in the presence of fungal pathogen while control represents seedling growth without pathogen or endophyte in a sterilized soil. Bars represent SE of the mean. Treatments with different letters are significantly different from each other (ANOVA test followed by SNK's post-hoc test, P < 0.05).

