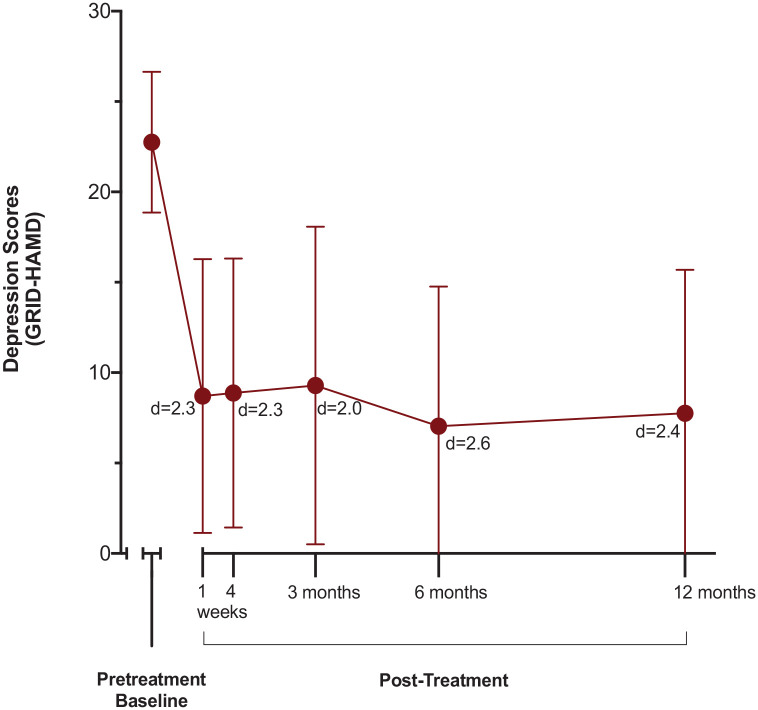
Figure 1.
Decrease in GRID-HAMD depression scores over time from baseline through the 12-month follow-up (N = 24).
Data points are means and brackets are ±1 SD; lower brackets are truncated at GRID-HAMD scores of 0. Mean GRID-HAMD was 22.8 (3.9) at baseline, 8.7 (7.6) at 1 week, 8.9 (7.4) at 4 weeks, 9.3 (8.8) at 3 months, 7.0 (7.7) at 6 months, and 7.7 (7.9) at 12 months post-treatment. All timepoints were significantly different from baseline (p < 0.001). Cohen d effect size is shown for each timepoint. Cohen d (95% CI) was 2.3 (1.5–3.1) at 1 week, 2.3 (1.5–3.1) at 4 weeks, 2.0 (1.3–2.7) at 3 months, 2.6 (1.7–3.4) at 6 months, and 2.4 (1.6–3.2) at 12 months.

