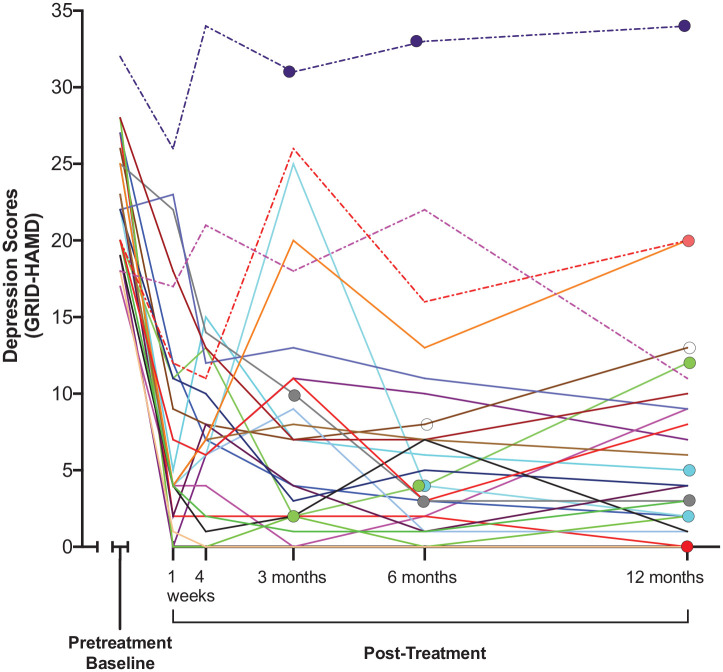
Figure 2.
Depression scores (GRID-HAMD) for each of 24 study participants at baseline and each of 5 follow-up assessment timepoints.
Individual participants are represented with different colors. Dashed lines indicate three participants who did not fulfill criteria for a treatment response at any post-treatment timepoint. Enlarged data points indicate participants who reported treatment with antidepressant medication, with the left-most enlarged data points showing the first follow-up timepoint at which medication use was reported.

