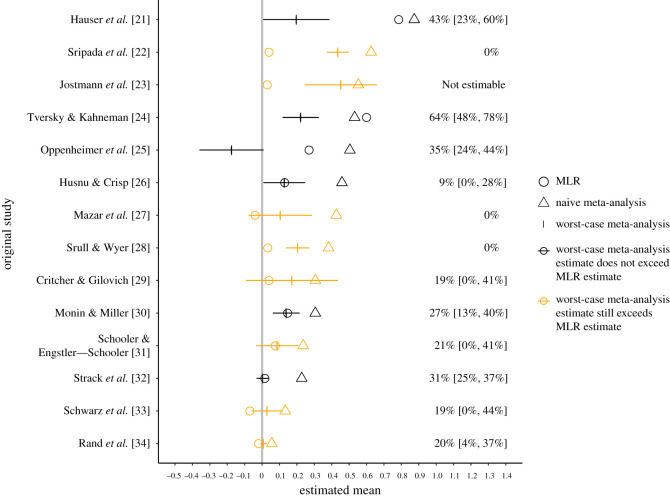
Figure 2.
The text values on the right represent estimated percentages and corresponding 95% CIs of true population effects in the naive meta-analysis that are as small as, or smaller than, the MLR estimate. CIs are omitted when they were not estimable via bias-corrected and accelerated bootstrapping [19]. The left side of the figure shows estimates from sensitivity analyses representing worst-case publication bias (vertical tick marks) versus naive meta-analysis estimates (triangles) and multi-laboratory replication estimates (MLR; circles). For orange-coloured meta-analyses, the worst-case estimate exceeds the MLR estimate, indicating that no amount of publication bias that results could entirely explain the discrepancy between the naive estimate and the MLR estimate.

